At a glance
Climate exposure is already part of the school-planning picture
This page brings together what the data can tell us about heat, extreme rainfall, and schools' ability to cope. It shows where the pattern is strongest and where a closer look may be useful.
Schools in the exposure frame
Government schools with at least one recorded heatwave or extreme-rainfall exposure since 2021.
Urgent combined priority
Schools at combined Priority 1-2, where the more severe of the two hazard priorities is urgent.
Compounding high risk
Schools independently at Priority 1-2 for both heatwave and extreme rainfall.
Capacity data gap
Schools without enough monitoring information to assign a combined priority.
What stands out
A few patterns are clear
The figures are a starting point for asking better local questions: which districts need a closer look, which hazard is driving the pattern, and where missing information is holding back a clear assessment.
The highest-priority schools cluster in the north-east
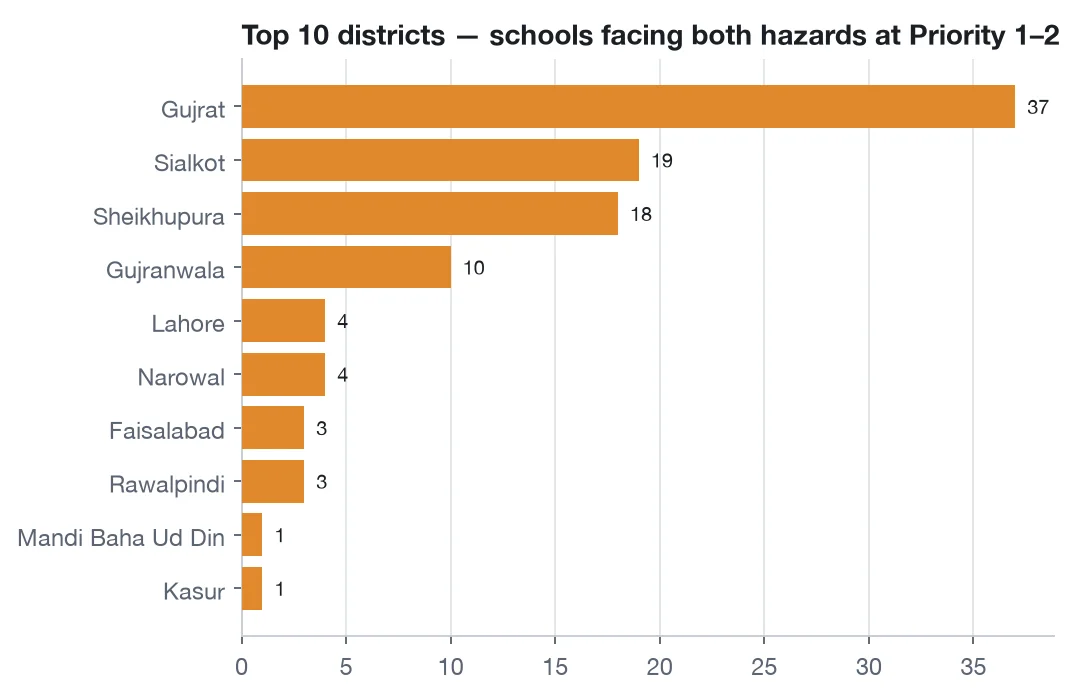
Gujrat, Sialkot, Sheikhupura, and Gujranwala contain 84 of the 103 schools at Priority 1-2 for both hazards (81.6%).
Heat and rainfall are not the same story
Average cumulative heat exposure is highest in Gujrat, Hafizabad, and Mandi Baha Ud Din. Rainfall exposure is highest in Narowal, Lahore, and Sialkot.
Recent rainfall events were especially large
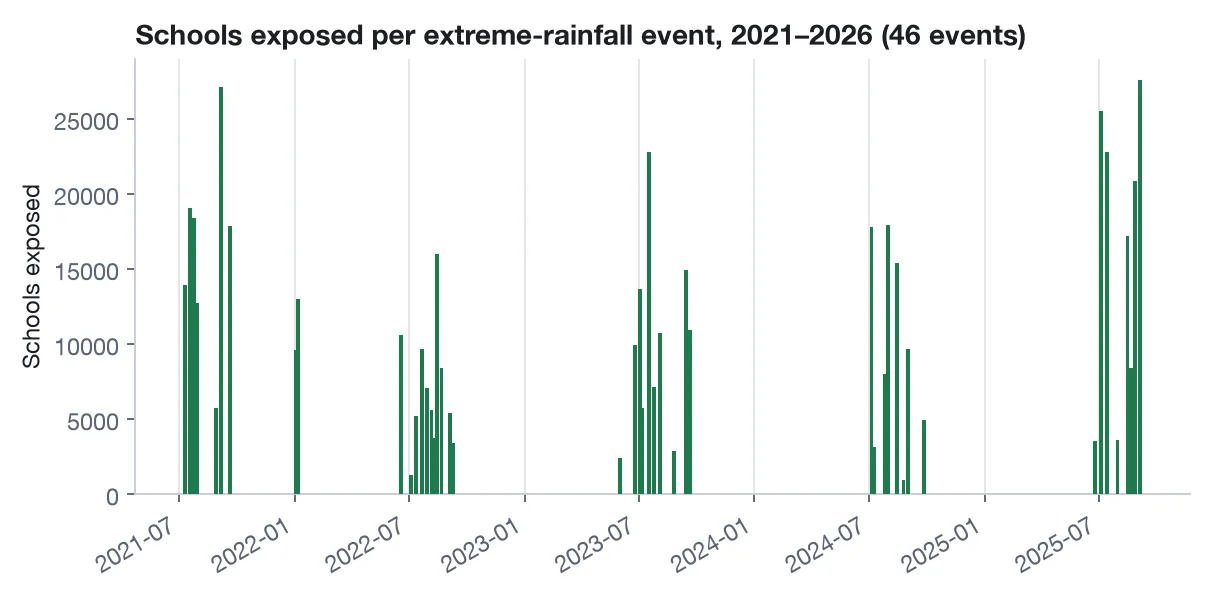
Four of the five largest recorded rainfall events by exposed schools occurred in 2025, making the event timeline useful for seasonal preparedness planning.
Missing capacity data matters
An unclassified school is not a low-risk school. Better coverage and more recent condition checks would make the picture more reliable.
Evidence behind the findings
Overview
Climate-related shocks can interrupt schooling, make attendance harder, and deepen existing inequalities in Pakistan. The 2022 floods alone disrupted schooling for an estimated 3.5 million children and pushed 1 million out of school entirely, with lower-income households bearing the greatest burden.
This project examines that problem by combining a scoping review, interviews with policymakers and data custodians, and analysis of climate, education, and socioeconomic data. Together, these strands map what is known, show where information is missing, and examine how climate shocks affect schools and learners differently.
At LUMS, CITY leads the geospatial and climate-exposure analysis, while the School of Education brings expertise in education policy and practice. The two teams work together to connect the data with the decisions it can inform.
Research questions
- Where and when are schools in Punjab and Sindh exposed to extreme heat, extreme rainfall, and dry spells — and how many students, by school level and gender, are affected?
- Do extreme climate events cause measurable enrolment disruption in Punjab government schools — how large, how persistent, and which school types are most affected?
- Which districts and school categories face compounding climate exposure and educational vulnerability, and should be prioritised for climate-resilience investment?
Expected outputs
- A climate extremes and school exposure atlas for Punjab and Sindh, with ranked district and school lists.
- A comprehensive research report integrating the scoping review, interview findings, and secondary data analysis.
- A policy brief with actionable recommendations for climate-resilient education planning in Pakistan.
- A stakeholder policy roundtable, convened at LUMS, bringing together government, development partners, and academia to validate findings and discuss policy implications.
Research design
Approach
The project draws on three complementary methods, with stakeholder interviews iterating across all of them:
- Systematic scoping review — mapping academic, grey, and policy literature on climate-related educational disruption, following Arksey & O'Malley and PRISMA-ScR screening principles.
- Key informant interviews — semi-structured interviews with policymakers, researchers, development partners, and data custodians across Punjab, Sindh, Khyber Pakhtunkhwa, and Balochistan.
- Secondary data analysis — triangulating satellite-derived climate indices (ERA5, CHIRPS, Sentinel-1 SAR) with administrative education datasets (EMIS/SIS) for Punjab and Sindh, to detect climate-extreme episodes and map them against school exposure and enrolment.
Workstreams
| Workstream | Focus |
|---|---|
| 1. Climate Extremes & School Exposure Atlas | Percentile-based detection of heatwave, extreme-rainfall, and dry-spell episodes on 1 km daily climate grids, overlaid on geo-located schools in Punjab and Sindh to estimate exposed schools and students, disaggregated by school level and gender. |
| 2. Enrolment Disruption Analysis (Punjab) | An event-study design on a five-year monthly enrolment panel, comparing exposed and matched unexposed schools around each climate episode, to estimate the size and persistence of enrolment disruption by hazard type. |
How the school priorities are set
Each hazard is scored in two parts. First, the schools cumulative exposure is grouped as Low, Moderate, or High using the 33rd and 67th percentiles among schools exposed to that hazard. Second, the schools coping capacity is taken from the PMIU visit closest to one of its own hazard years. The two parts are then combined using the same table for heatwave and rainfall.
| Priority | Exposure | Coping capacity | What it means |
|---|---|---|---|
| 1 | High | Weak | Most urgent: frequent exposure and major capacity gaps. |
| 2 | High | Partial | High exposure with important gaps. |
| 3 | High | Adequate | High exposure, but the recorded capacity is comparatively stronger. |
| 4 | Low or Moderate | Weak or Partial | Less exposure, but capacity gaps still need attention. |
| 5 | Low or Moderate | Adequate | Lower exposure and comparatively stronger recorded capacity. |
| Unclassified | Any | Missing | There is not enough capacity information to assign a priority; this is not a low-risk label. |
For heatwave, capacity combines electricity and drinking water. A dimension is Adequate when it is available, functional, and fully provided; it is Weak when it is unavailable or non-functional; otherwise it is Partial. The combined heat capacity is Adequate only when both dimensions are Adequate, Weak only when both are Weak, and Partial otherwise.
For extreme rainfall, capacity combines building condition, learning-space continuity, sanitation, and safe water. Learning space is Adequate at 90% or more of classrooms used for teaching, Partial at 70% to under 90%, and Weak below 70%. Sanitation uses the same 90% and 50% cut-offs for functional toilets. Structural condition and safe water use the recorded PMIU categories. Drainage is not scored because it is available only as sparse free text.
In the combined view, a school keeps the more severe of its two hazard priorities. A separate compounding flag is set only when both hazard priorities are 1 or 2.
Evidence atlas
Explore the evidence: Punjab School Climate-Exposure Atlas
Workstream 1 brings together heatwave and extreme-rainfall records for government schools in Punjab from 2021 onward. The dashboard below lets you see where exposure is concentrated, where the two hazards overlap, and how the available coping-capacity information changes the picture.
What the snapshot shows
Start with the combined view to see the overall pattern, then use the heat and rainfall tabs to see which hazard is driving it.
All four percentages use the 52,196 tracked schools as the denominator.
This view brings the two hazards together. Each school is shown by whichever of its two hazard priorities is more severe.
Percentages are the share of 52,196 schools tracked across the two hazards.
Every tracked school, coloured by combined priority. Pan, zoom, and click a marker (or cluster) for details — the map updates with the sidebar filters and the legend below.
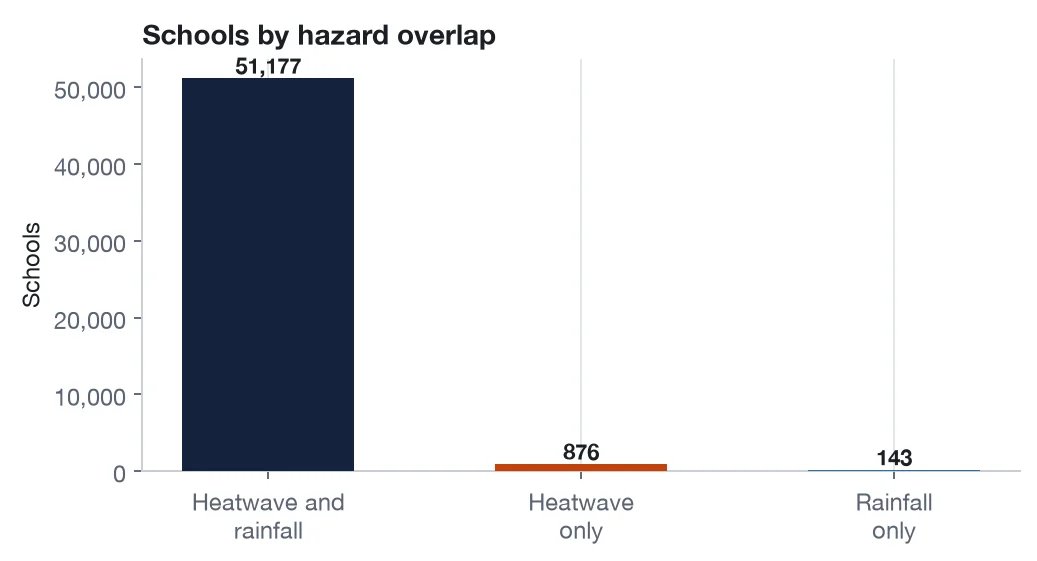
The first chart shows how many schools appear in each hazard record. The second shows where the 103 compounding Priority 1-2 schools are located.
Cumulative heatwave exposure per school since 2021, classified against coping capacity from the nearest government (PMIU) visit.
Percentages are the share of 52,196 schools tracked across the two hazards.
Pan, zoom, and click a marker for details — updates with the sidebar filters and legend below.
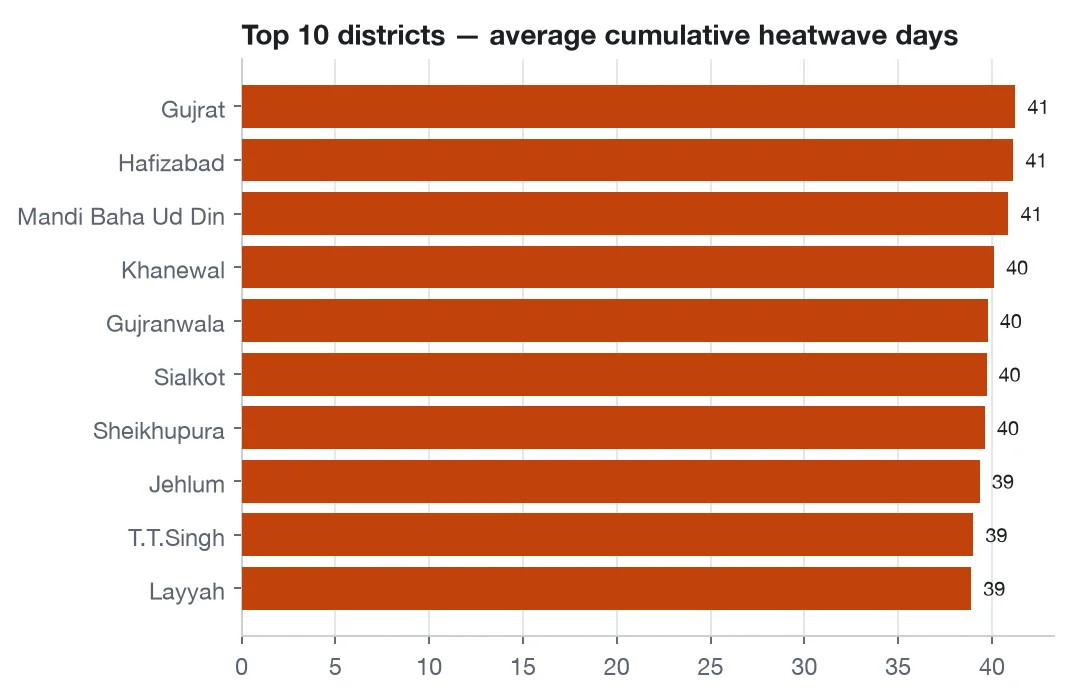
The chart compares average cumulative heatwave-day exposure across districts; Gujrat, Hafizabad, and Mandi Baha Ud Din are highest in this snapshot.
Cumulative exposure across the 46 extreme-rainfall events recorded since 2021, classified against four PMIU-visit coping-capacity proxies.
Percentages are the share of 52,196 schools tracked across the two hazards.
Pan, zoom, and click a marker for details — updates with the sidebar filters and legend below.
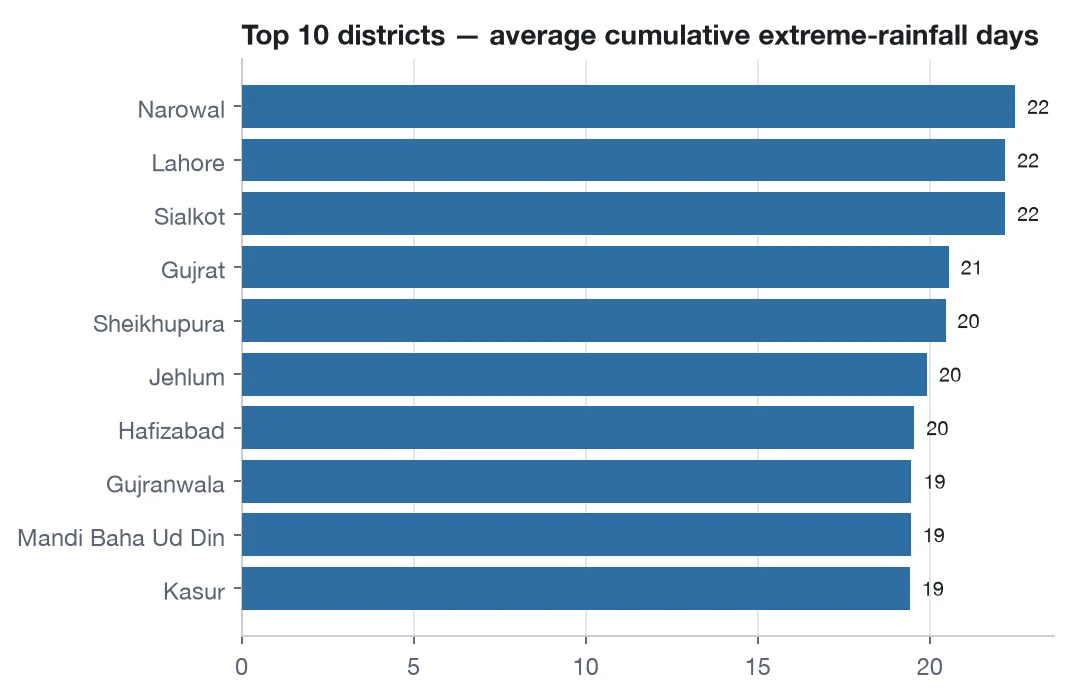
The chart compares average cumulative extreme-rainfall-day exposure across districts; Narowal, Lahore, and Sialkot are highest in this snapshot.
The timeline shows the number of schools exposed in each of the 46 recorded events; four of the five largest were in 2025.
| Event | Date | Schools exposed | Students exposed | Max 3-day rainfall |
|---|---|---|---|---|
| 2025_R08 | 05 Sep 2025 | 27,610 | 6.51M | 260.0 mm |
| 2021_R06 | 06 Sep 2021 | 27,081 | 6.73M | 461.5 mm |
| 2025_R02 | 05 Jul 2025 | 25,537 | 6.55M | 206.6 mm |
| 2025_R03 | 14 Jul 2025 | 22,802 | 5.92M | 175.1 mm |
| 2023_R05 | 18 Jul 2023 | 22,790 | 5.48M | 368.4 mm |
The five largest of 46 recorded events, ranked by schools exposed.
Search by school name. Results respect the sidebar's district and school-level filters.
Search using at least three letters.