



Executive summary
Building evidence for climate-resilient education planning
This study examines how climate-related disruptions (floods and heatwaves) affect education in Pakistan, with particular attention to data gaps, socioeconomic inequalities, and policy responses needed to build climate resilience in the education sector. Using a systematic scoping review, key informant interviews, and secondary analysis of climate and education datasets, the research maps existing evidence, identifies what data and gaps exist across climate, education, and socioeconomic indicators, and examines how climate events differentially impact educational access and outcomes across socioeconomic groups. Findings are intended to inform evidence-based policymaking at federal and provincial levels, strengthening climate-resilient education planning and improving the integration of climate and education data systems.
Research questions
- What climate, education and SES data exist in Pakistan, and what gaps limit understanding of educational disruption?
- In what ways do extreme climate events influence academic achievement and educational access across different socioeconomic groups?
- What analytical approaches, interventions and policies show promise for educational access during extreme climate events?
Early results · Punjab
Exposure is widespread. The priority is to distinguish where action is most urgent.
The first atlas brings together recorded heatwave and flooding exposure, including flood-hazard evidence within the rainfall view, with available evidence on schools’ ability to cope. It is designed to support closer local assessment and better-targeted planning, not to predict future events.
Schools in the exposure frame
Available schools with at least one recorded heatwave or flooding exposure since 2021; flood hazard is incorporated into rainfall priority.
Urgent combined priority
Schools at combined Priority 1–2, where the more severe of the two hazard priorities is urgent.
Compounding high risk
Schools independently at Priority 1–2 for both heatwave and flooding.
Capacity data gap
Schools without enough monitoring information to assign a combined priority.
Results highlights
What the early evidence shows
These results are a starting point for better local questions: which districts need a closer look, which hazard is driving the pattern, and where missing information is holding back a confident assessment.
The highest-priority schools cluster in the north-east
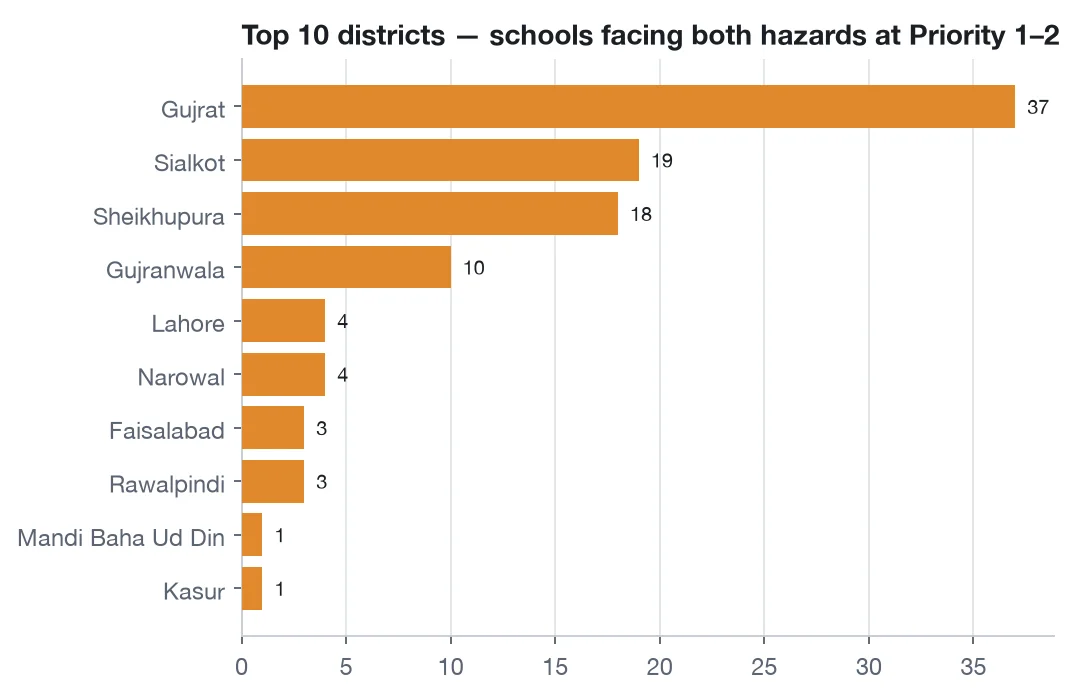
Gujrat, Sialkot, Sheikhupura, and Gujranwala contain 84 of the 117 schools at Priority 1–2 for both hazards (81.6%).
Heat and rainfall are not the same story
Average cumulative heat exposure is highest in Gujrat, Hafizabad, and Mandi Baha Ud Din. Rainfall exposure is highest in Narowal, Lahore, and Sialkot.
Recent rainfall events were especially large
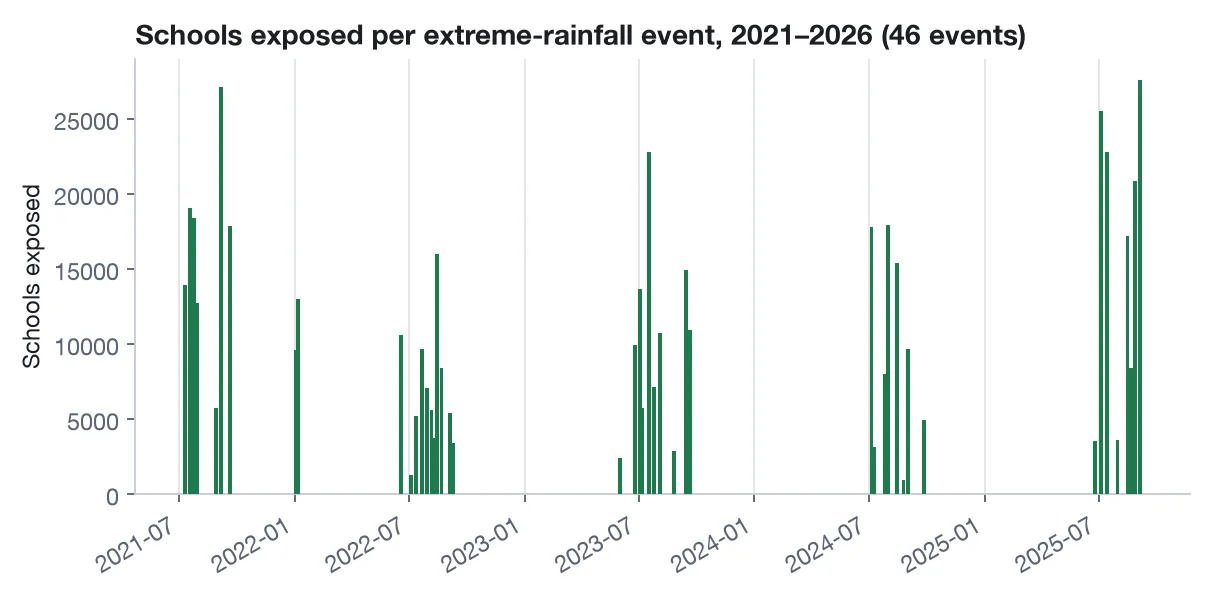
Four of the five largest recorded rainfall events by exposed schools occurred in 2025, making the event timeline useful for seasonal preparedness planning.
Missing capacity data matters
An unclassified school is not a low-risk school. Better coverage and more recent condition checks would make the picture more reliable.
Evidence behind the findings
TEAM

Dr. Zubair Khalid

Dr. Jessica Albrent

Dr. Mansoor Khan

Mina Arif

Asfra Rizwan

Hajra Javed

Aymen Asif

Mahnoor Naveed

Nausherwan Malik
Research design
Approach
The project draws on three complementary methods, with stakeholder interviews iterating across all of them:
- Systematic scoping review — mapping academic, grey, and policy literature on climate-related educational disruption, following Arksey & O'Malley and PRISMA-ScR screening principles.
- Key informant interviews — semi-structured interviews with policymakers, researchers, development partners, and data custodians across Punjab, Sindh, Khyber Pakhtunkhwa, and Balochistan.
- Secondary data analysis — triangulating satellite-derived climate indices (ERA5, CHIRPS, Sentinel-1 SAR) with administrative education datasets (EMIS/SIS) for Punjab and Sindh, to detect climate-extreme episodes and map them against school exposure and enrolment.
Workstreams
| Workstream | Focus |
|---|---|
| 1. Climate Extremes & School Exposure Atlas | Percentile-based detection of heatwave, flooding, and dry-spell episodes on 1 km daily climate grids, with flood-hazard evidence incorporated into the rainfall exposure view, overlaid on geo-located schools in Punjab and Sindh to estimate exposed schools and students, disaggregated by school level and gender. |
| 2. Enrolment Disruption Analysis (Punjab) | An event-study design on a five-year monthly enrolment panel, comparing exposed and matched unexposed schools around each climate episode, to estimate the size and persistence of enrolment disruption by hazard type. |
How the school priorities are set
Each hazard is scored in two parts. First, the school’s exposure is grouped as Low, Moderate, or High. For rainfall, the exposure class reflects both recorded flooding exposure and the school flood-hazard signal; the more severe of the two is used. Second, the school’s coping capacity is taken from the PMIU visit closest to one of its own hazard years. The two parts are then combined using the same table for heatwave and rainfall.
| Priority | Exposure | Coping capacity | What it means |
|---|---|---|---|
| 1 | High | Weak | Most urgent: frequent exposure and major capacity gaps. |
| 2 | High | Partial | High exposure with important gaps. |
| 3 | High | Adequate | High exposure, but the recorded capacity is comparatively stronger. |
| 4 | Low or Moderate | Weak or Partial | Less exposure, but capacity gaps still need attention. |
| 5 | Low or Moderate | Adequate | Lower exposure and comparatively stronger recorded capacity. |
| Unclassified | Any | Missing | There is not enough capacity information to assign a priority; this is not a low-risk label. |
For heatwave, capacity combines electricity and drinking water. A dimension is Adequate when it is available, functional, and fully provided; it is Weak when it is unavailable or non-functional; otherwise it is Partial. The combined heat capacity is Adequate only when both dimensions are Adequate, Weak only when both are Weak, and Partial otherwise.
For flooding, the exposure class combines recorded rainfall exposure with flood-hazard evidence; the more severe exposure class is used for priority. Capacity combines building condition, learning-space continuity, sanitation, and safe water. Learning space is Adequate at 90% or more of classrooms used for teaching, Partial at 70% to under 90%, and Weak below 70%. Sanitation uses the same 90% and 50% cut-offs for functional toilets. Structural condition and safe water use the recorded PMIU categories. Drainage is not scored because it is available only as sparse free text.
In the combined view, a school keeps the more severe of its two hazard priorities. A separate compounding flag is set only when both hazard priorities are 1 or 2.
Evidence atlas
Explore the evidence: Punjab School Climate-Exposure Atlas
Workstream 1 brings together heatwave and flooding records for available schools in Punjab from 2021 onward, with flood-hazard evidence incorporated into rainfall exposure. The dashboard below lets you see where exposure is concentrated, where the two hazards overlap, and how the available coping-capacity information changes the picture.
What the snapshot shows
Start with the combined view to see the overall pattern, then use the heat and rainfall tabs to see which hazard is driving it.
All four percentages use the 52,196 tracked schools as the denominator.
This view brings the two hazards together. Each school is shown by whichever of its two hazard priorities is more severe.
Percentages are the share of 52,196 schools tracked across the two hazards.
Every tracked school, coloured by combined priority. Pan, zoom, and click a marker (or cluster) for details — the map updates with the sidebar filters and the legend below.
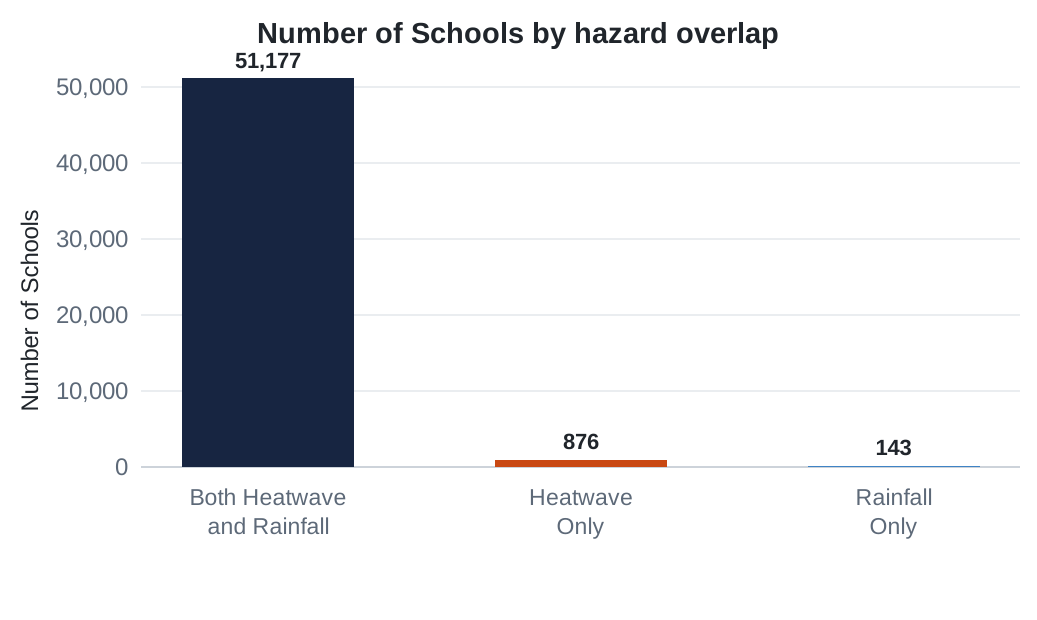
The first chart shows the Number of Schools in each exposure group: Both Heatwave and Rainfall, Heatwave Only, or Rainfall Only. The second shows where the 117 compounding Priority 1–2 schools are located.
Cumulative heatwave exposure per school since 2021, classified against coping capacity from the nearest government (PMIU) visit.
Percentages are the share of 52,196 schools tracked across the two hazards.
Pan, zoom, and click a marker for details — updates with the sidebar filters and legend below.
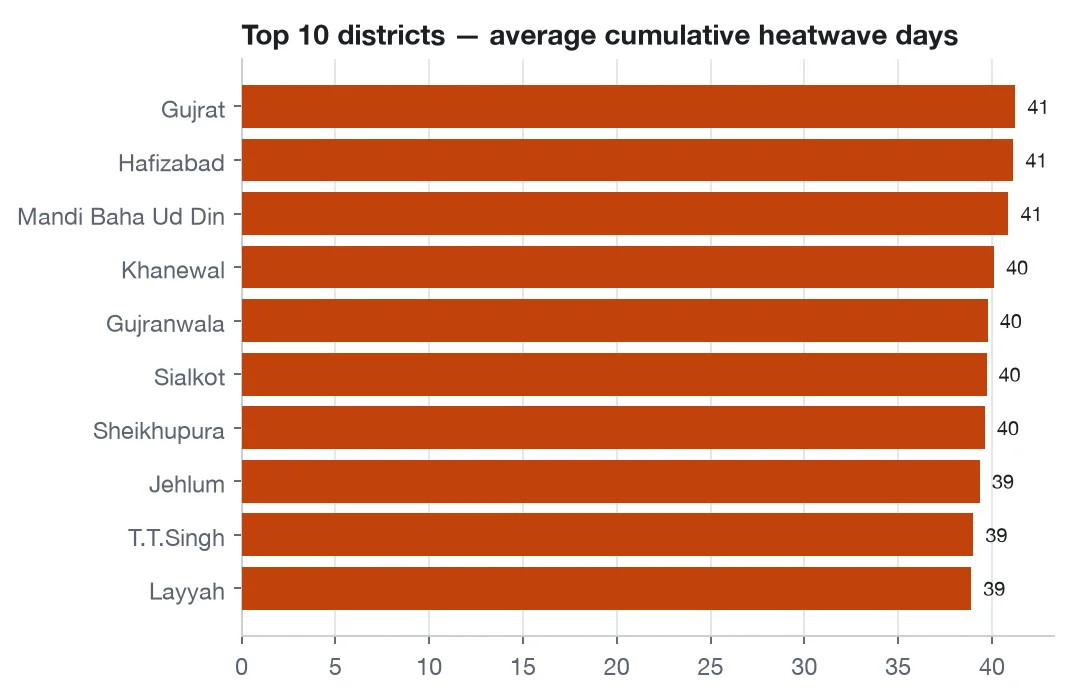
The chart compares average cumulative heatwave-day exposure across districts; Gujrat, Hafizabad, and Mandi Baha Ud Din are highest in this snapshot.
Extreme-rainfall exposure across 46 recorded events. Flooding is represented by the school flood-hazard signal on the exposure side; four PMIU-visit coping-capacity proxies are kept separate.
Percentages are the share of 52,196 schools tracked across the two hazards.
Pan, zoom, and click a marker for details — updates with the sidebar filters and legend below.
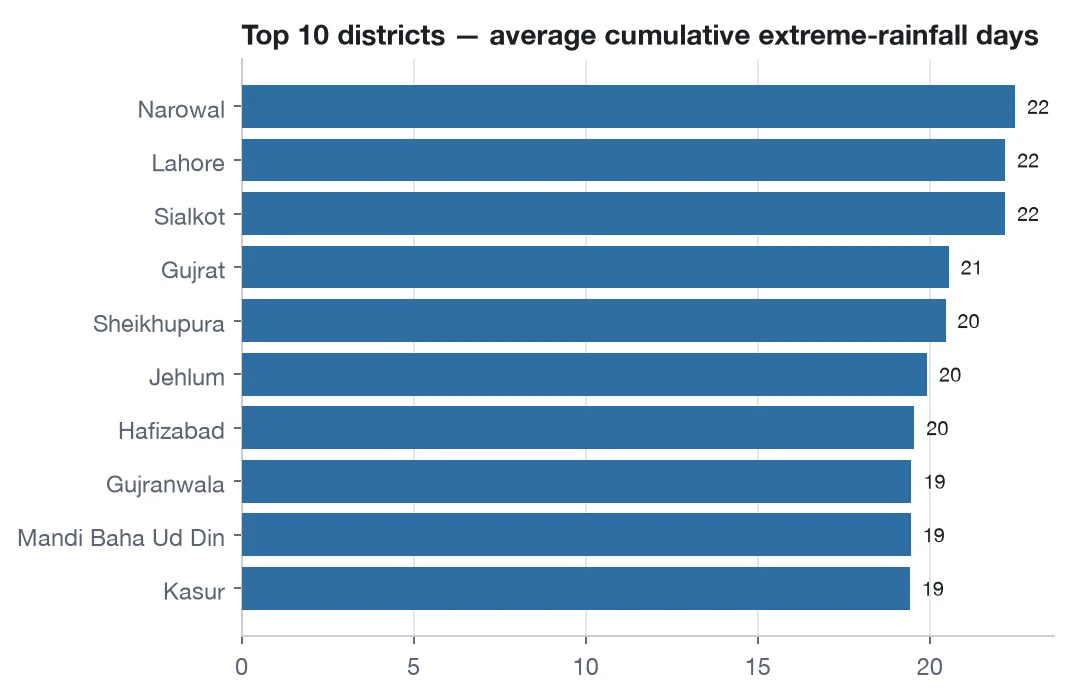
The chart compares average cumulative flooding-day exposure across districts; Narowal, Lahore, and Sialkot are highest in this snapshot.
The timeline shows the number of schools exposed in each of the 46 recorded events; four of the five largest were in 2025.
| Event | Date | Number of Schools exposed | Students exposed | Max 3-day rainfall |
|---|---|---|---|---|
| 2025_R08 | 05 Sep 2025 | 27,610 | 6.51M | 260.0 mm |
| 2021_R06 | 06 Sep 2021 | 27,081 | 6.73M | 461.5 mm |
| 2025_R02 | 05 Jul 2025 | 25,537 | 6.55M | 206.6 mm |
| 2025_R03 | 14 Jul 2025 | 22,802 | 5.92M | 175.1 mm |
| 2023_R05 | 18 Jul 2023 | 22,790 | 5.48M | 368.4 mm |
The five largest of 46 recorded events, ranked by schools exposed.
Search by school name. Results respect the sidebar's district and school-level filters.
Search using at least three letters.
Project documentation
Outputs
- DARE-RC Insight Note
Project insight note and emerging findings - Concept Note
Project rationale, scope, and research design