

WORKSHOP & TRAINING
February 29, 2024
Exploring the bittersweet relationship of schools’ closure and smog
March 4, 2024WORKSHOP & TRAINING
February 29, 2024Exploring the bittersweet relationship of schools’ closure and smog
March 4, 2024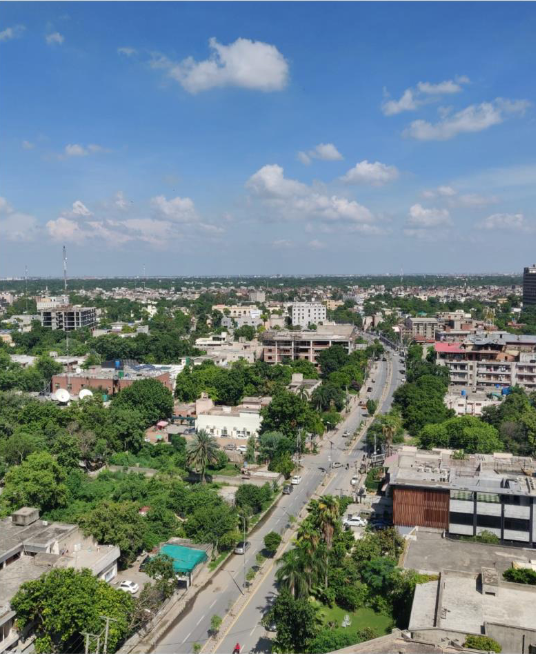
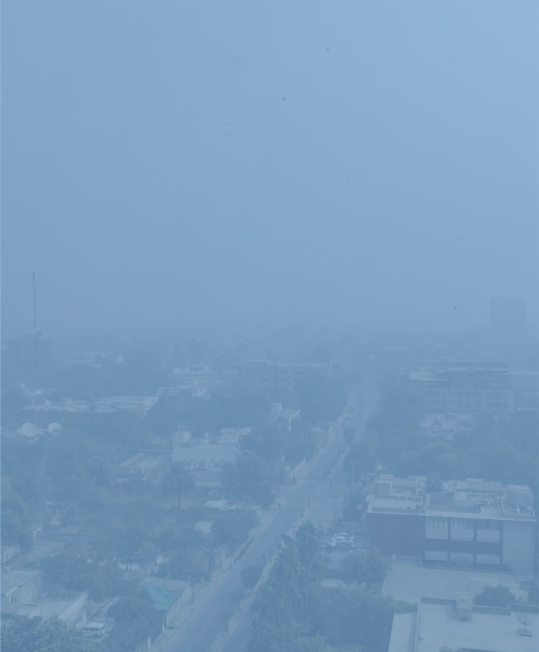
Finding the blue skies: Lahore’s Air Apocalypse
Air pollution has emerged as a significant issue in the subcontinent. Multiple Pakistani cities have made the list of the wor ld’s most polluted cities in recent years. Lahore, the provincial capital of Punjab, is one of the world’s three most polluted cities. The current state of Lahore’s air quality puts the lives of the city’s 12 million residents in grave danger. For the most part of the last three years, the air quality index (AQI) stayed between poor to severe. The AQI is a metric used to quantify the effect of air pollution on human health based on limited exposure. The higher the AQI number, the more health risks there are. Typically, environmental protection agencies/departments collect and publish these values together with a health recommendation for residents. In winters the smog, fog, and haze resulted in the closure of the major highways, airports, and transportation incurring economic losses and social unrest. Many road accidents due to smog are also reported in the media resulting in deaths and financial losses. The aggravation of respiratory diseases due to smog has increased the load on the health care system already combating COVID-19. While all this going on in Lahore and its surrounding areas the Air Quality Life Index (AQLI) from the Energy Policy Institute at the University of Chicago (EPIC) released their 2021 annual report on the effects of poor air quality on the health of an average Pakistani citizen. The AQLI report suggests that an average Pakistani tends to lose 3.9 years of life expectancy if the current levels of air pollution persist. It also reports that in a few most polluted areas the loss in life expectancy can go up to 7 years. An average citizen of Lahore is expected to gain 5.3 years’ worth of life expectancy if the World Health Organization (WHO) guidelines for particulate matter (PM) 2.5 are met. In 2021, the air pollution got adverse that the Punjab government decided to close the schools on Mondays as well other along with the weekend and winter break also began earlier than usual to deal with the worsening air pollution situation.
In a recent verdict, the Lahore High Court ordered the Punjab government to take concrete steps to curb the air pollution in Lahore. The court also stated that corporation should also fulfill their corporate social responsibility and reduce emissions, and government must enforce the already existing suggestions from the Lahore smog commission report and Punjab clean air act to mitigate the smog situation. The Lahore smog commission report recommended that the Punjab government must increase the active reference-grade air quality monitoring stations from three to twelve. A reference-grade air quality monitoring station is a very expensive (PKR 7 to 10 million) monitoring solution that precisely measures air pollution and follows industry-proven and WHO-recommended air pollution measurement procedures. To comply, the Punjab government raised 280 million US dollars from World Bank funding and is now in the process of procuring reference-grade continuous air quality monitoring stations for Lahore. Hopefully, after these systems are installed, we will have more precise data on Lahore’s air pollution. Air quality and a city’s capability to tackle air pollution are quantified using three indicators: (1) capacity, (2) data, and (3) public awareness. Here, capacity refers to public and private measurement infrastructure, data refers to the public availability of air quality measurements to develop data-driven policies, and public awareness refers to the general public’s interest in the issue and how the public views the ramifications of air quality issues. Let’s see how Lahore fared in each of these aspects. The Environmental Protection Department (EPD) stated in the Lahore High Court that they have three operational continuous reference-grade air quality monitoring stations and that air quality data, along with health advisories, are provided every day on their website and social media. The US embassy in Lahore also has one reference-grade air quality monitoring station managed by AirNow. There are also eight low-cost air quality monitoring sensors in Lahore PurpleAir. The low-cost sensing solution costs around 200 US dollars and provides values of PM2.5. The PurpleAir data is also available to the pubic to review. We here at Lahore University of Management Sciences (LUMS) have also deployed a low-cost air quality monitoring station, and the data from this station is also made available for the public. The locations of the reference-grade and low-cost stations are marked on the map of Lahore. Here we also want to highlight that there are also a couple of reference-grade monitoring stations in Lahore but their data is not publicly available. LUMS is also in the process of acquiring more low-cost sensors data from IQAir Before proceeding with the investigation of the air quality data, it is important to note that we will only consider PM2.5 values because this is the pollutant that accounts for the majority of the available data and is also the most problematic in the Pakistani context. Lahore’s capacity to measure the air quality
of all 665 square kilometers is not even close to adequate. Though government and private entities are working on it, still it requires a monumental coordinated effort to solve the capacity issue.
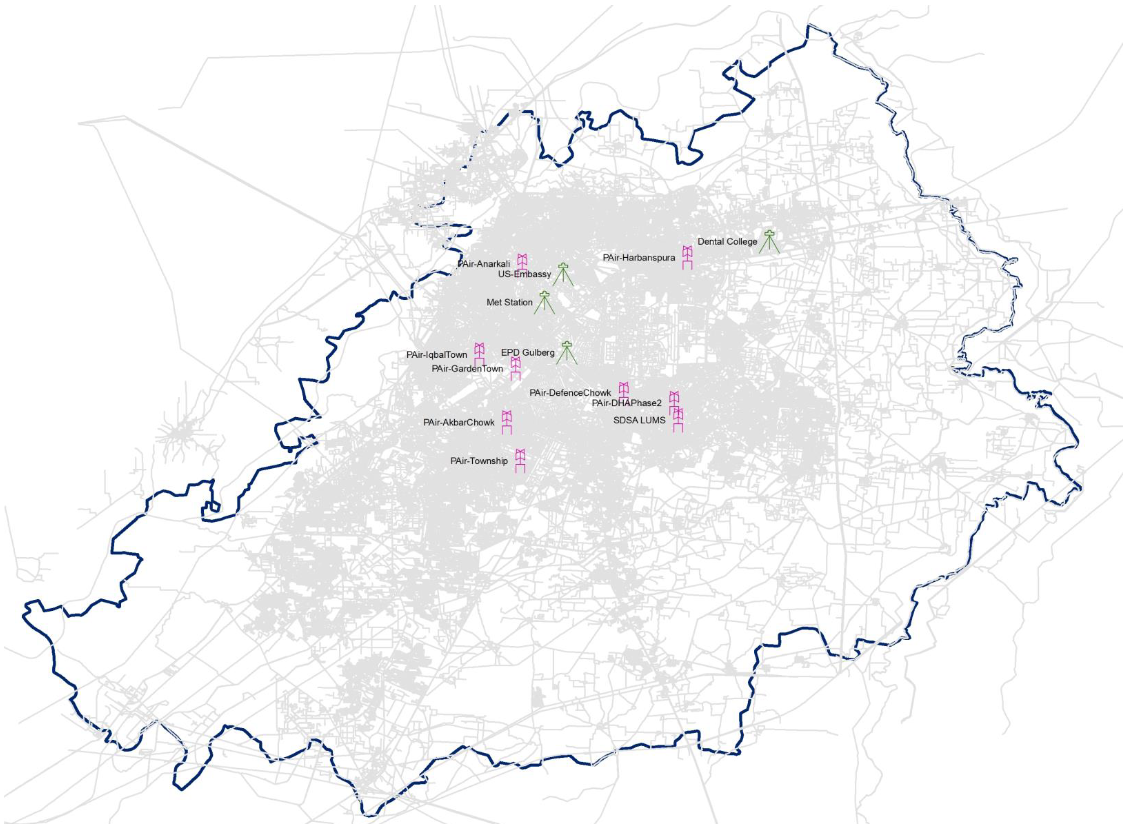
Four reference-grade(green) and nine low-cost (pink) air quality monitoring stations are tagged on the map of Lahore.
Air pollution is the result of a number of variables that may or may not be directly related to known sources of pollution. Wind directions, temperature, and humidity, among other factors, all contribute significantly to the deterioration of the air pollution situation. Placing the blame for air pollution squarely on the shoulders of a single source is not a suitable method, and external variables must be addressed when conducting air pollution-related research. External influences are also taken into account by reference-grade monitors.
We have collected all publicly available air quality data from all available sources and performed a preliminary analysis. Our analysis highlighted a lot of disparities in the reported data from multiple sources. Before providing the details of the data analysis and the lessons learned from this exercise, it is important to take a look at the timelines of the data availability from all reference-grade and low-cost monitoring stations. We have collected the EPD reported data from their website, the data collected was from January 2019 to January 2022. The US embassy started reporting data from May 2019. We collected the data from May 2019 to January 2022. For low-cost sensors, we got data of eight PurpleAir sensors from August 2021 to January 2022. We have also collected the air quality information from December 2021 to January 2022 by deploying low-cost air quality sensors in LUMS. The following charts illustrate the timelines for both reference grade and low-cost sensors.
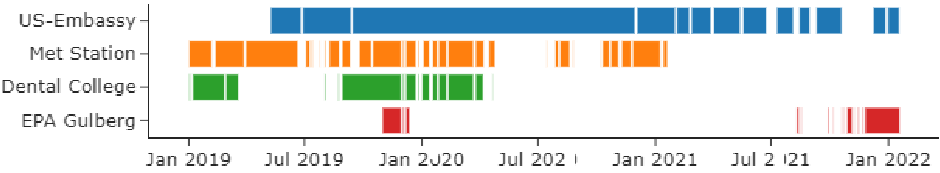
Reference grade continuous air quality monitoring system timelines
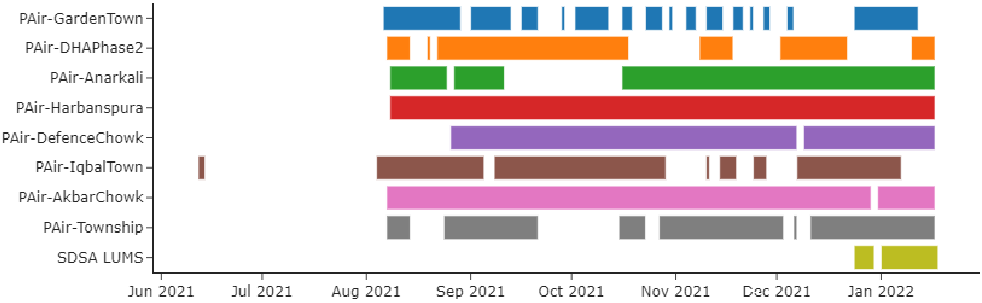
Low–cost air quality monitoring systems timelines
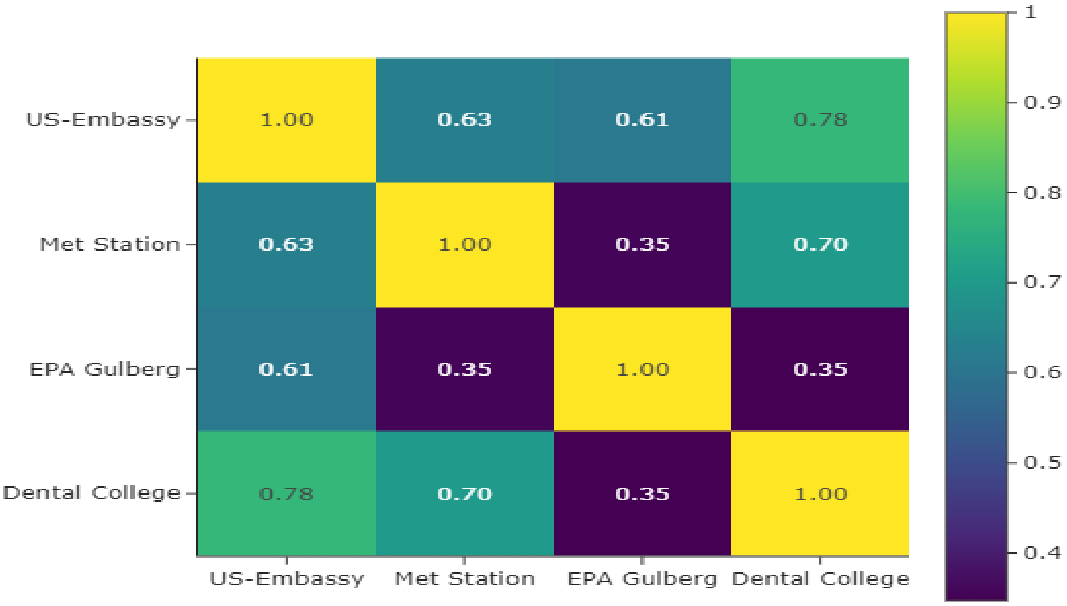
Once the data from all sources (reference-grade and low-cost air quality monitoring stations) is gathered. We have compared the US embassy reported PM2.5 concentrations with the EPD reported concentrations of the last three years. To our surprise, when we compared the data from reference grade continuous air quality monitoring stations, we noticed surprising results listed as follows;
- The data reported by the US embassy has a very low correlation with other reference-grade systems.
- One may claim that the distance between two reference grade stations is the root cause of the poor statistical association seen between the two stations. The distance between the US embassy and metrological station reference-grade station is 4.6 Km which is relatively close to the US embassy compared to the other two stations. Both reference-grade stations also consider the effect of the external factors (temperature, wind speed/direction, humidity, etc.) while reporting the air quality values. Given the distance, the correlation between the US embassy and met station is only 0.63, which is a poor value given the correlation of two stations that are close to each other must be above 0.9.
- The same trend is observed for all EPD stations. We are not sure why there is a drastic difference between the values reported by the EPD and the US embassy. We leave this on the audience to decide and think out loud.
EPD met air quality station reported data from January 2019 to 20 January 2021, EPD met air quality monitoring station has not reported PM2.5 concentrations from mid-April 2020 to mid-October 2020. During data analysis, we have observed many anomalies. On 14th November 2020, the PM2.5 concentration reported by the EPD Met station was 63.734, and on the same day, the US embassy reported 452.16 micrograms per cubic meter. It is a huge difference and can only be explained as negligence on the part of the EPD. Similar disparities were observed between 07 October 2020 to 20 January 2021 before the EPD met station stopped reporting values.
We have also compared the air quality values (PM 2.5 concentrations) reported by the US embassy with values reported by the a ir quality monitoring station in Dental College. The EPD dental college monitoring station reported data from January 2019 to April 2020, whereas the US embassy monitoring station is providing air quality values from May 2019. We found that the data reported by both monitoring stations can be seen as slightly correlated with a correlation value of 0.78 compared to the data reported by the met station monitoring station. Unfortunately, the Dental college air quality monitoring station stopped reporting in April 2020.
The EPD Gulberg station first reported PM2.5 concentrations between October to December 2019. It was again operational from mid- August 2021 to date. The values reported by EPD Gulberg and the US embassy do not correlate at all. For instance, the PM2.5 concentration reported by EPD Gulberg station on 21st November 2019 was nearly 174 micrograms per cubic meter, whereas, on the same day, the average PM 2.5 concentration reported by the US embassy was 460 micrograms per cubic meters. A similar trend of underreporting is observed from 31st October to 12th December 2019. The value reported by EPD Gulberg from August 2021 to date is also not in agreement with the US embassy. This discrepancy in values can be because of the lack of technical understanding of the air quality parameters or their reporting mechanism, or the monitoring stations are faulty and require maintenance services.
A massive underreporting of the PM 2.5 concentrations by the EPD’s reference-grade air quality monitoring stations is visible in the figure. The dotted red box is highlighting one of the instances where the values from October 2020 to January 2021 are continuously underreported. A similar trend can be observed from October 2021 to January 2022.
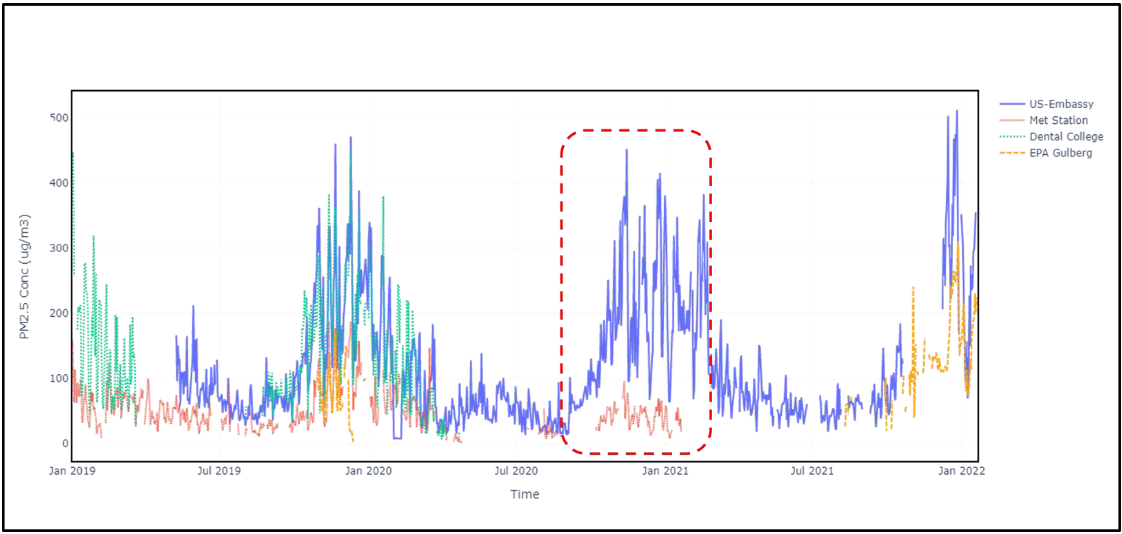
Comparison of PM 2.5 concentrations reported by reference-grade air quality monitoring stations in Lahore.
Deploying and managing reference-grade air quality monitoring stations is an expensive and complex undertaking. Usually, these air quality monitoring systems are installed and maintained by national environmental protection agencies, embassies, and industries. Since reference-grade monitoring stations are expensive and deploying these stations in bulk is not possible. To fulfill this gap low- cost air quality measurement systems are employed. These sensors provide data close to the reference-grade systems with a certain error rate. Low-cost air quality sensing systems require calibration, which can be done by following the rich literature on calibration algorithms or using calibration lab facilities. In Lahore, PurpleAir and SDSA lab LUMS have deployed a few low-cost sensors. There are low-cost air quality measurement sensors in Lahore but their data is not made public. We have collected the publicly available data of eight PurpleAir and one sensor from SDSA lab LUMS. We have compared the low-cost air quality measurement values with the reference-grade systems from EPD and the US embassy. To our surprise, the values from low-cost sensors are batter correlated with the reference-grade monitoring station of the US embassy, whereas the low-cost air quality data showed poor correlation with the EPD’s reference grade measurement systems.
The plot indicates that the low-cost air quality measurements are very close to the measurements taken from the US embassy reference-grade measurement system. Whereas a clear underreporting of EPD Gulberg values from November 2021 to January 2022 is also very visible. This result also confirms, that there are shortcomings in the EPD data collection and reporting mechanism, and the measuring equipment requires maintenance services. These low-cost measurement solutions are easy to deploy and can be bought in bulk.
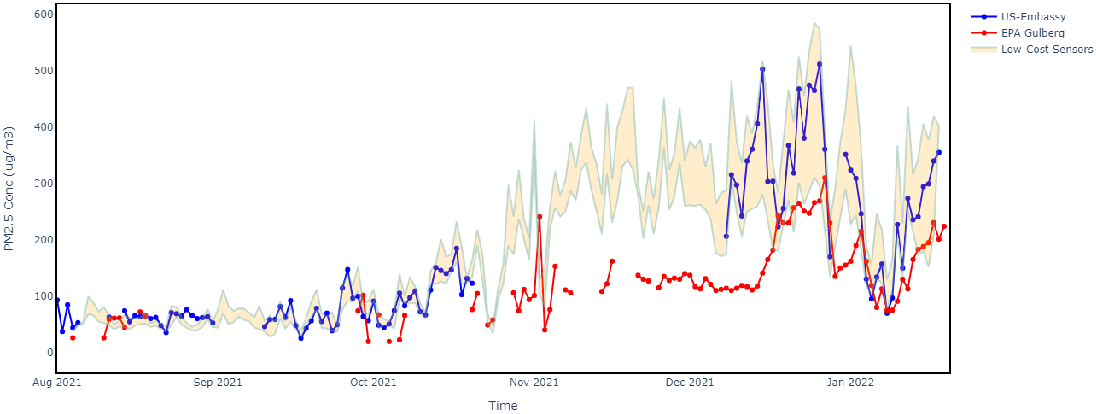
The comparison of low–cost air quality sensor values with the reference–grade air quality monitoring systems.
A hybrid approach, in our view, is possible and may be created for Lahore to provide maximum coverage and more detailed data on air quality. In hybrid air quality networks, the government agency deploys a reference-grade system and surrounds it with a low-cost air quality sensor network (deployment of low-cost sensors in the radius of 4km). This deployment will address the calibration difficulty associated with low-cost sensing while also avoiding the expense and complexity associated with the installation of several reference- grade air quality measuring equipment. Additionally, our investigation found that Lahore is incapable of dealing with air quality crises owing to its inability to measure air quality effectively. Our analysis also shows that the existing EPD air quality data is unreliable, and determining the main reason for this inaccuracy is critical. We are not criticizing anybody in this endeavor; rather, we are just providing the facts from publicly accessible datasets and leaving the reader’s judgment to the reader.
The third component of accessing the ability of a city to deal with the air quality issue is its public awareness. To cover this component, we conducted a survey in different public and private universities in Lahore. In the survey, we have asked the following questions:
- What is your age group?
- Please specify your gender.
- Please state the name of your university.
- What is the level of air pollution that you perceive in Lahore?
- Good: Minimal impact
- Satisfactory: May cause discomfort to sensitive people
- Moderate: May cause discomfort to people with respiratory diseases
- Poor: May cause discomfort to all people in general
- Very Poor: May cause respiratory illness on prolonged exposure
- Severe: May cause health impact to healthy people and severe impact to sensitive people
- What is your physical sensory perception of air quality? Mark all relevant.
- Visual Feedback (Smog, Fog, Haze, etc.)
- Smell
- Eyes Burning
- Breathing Problems (coughing, irritation in throat, etc.)
- None of above
- What are your sources that you use to check the value of air quality? Mark all relevant.
- Mobile Application
- News
- Social Media
- Website (IQAir, EPD, etc.)
- Friends and Social Circle
- None
- Choose the level of negative impact/effect you consider air pollution has on your health?
- High Impact
- Moderate Impact
- Low Impact
- Do you have respiratory issues? If yes, have the issues been aggravated in the past month?
- No respiratory issues
- Yes, but did not aggravate
- Yes, aggravated
- With the advent of smog, what are the precautions you are taking, if any. Mark all relevant boxes.
- Decreased outdoor activity
- Wearing mask
- Using air purifier
- Keeping windows/doors closed
- No specific precaution
- Choose ONE main source/sector which you think is primarily responsible for air pollution.
- Agriculture (including crop burning)
- Households (including cooking, heating, and cooling)
- Domestic Waste (including waste burning)
- Industry (including manufacturing facilities)
- Construction (including city development)
- Transport (cars, motorcycles, buses, etc.)
- Deforestation h. Both industry and transportation play a vital role
- All of above
We have conducted this survey from 21st December 2021 to 10th January 2022. We have received 177 responses from different universities in Lahore. As expected, nearly 60% of the participants were between 18-22 years old. 67% of the responses came from males, and 37% came from female participants. We collected responses from 11 different public and private universities in Lahore. Nearly 73% of the responses (44% said severe and 29% said very poor) suggested that the air quality in Lahore ranges from very poor to severe. Nearly 81% of the responses suggested that smog/fog/haze is their sensory perception for air quality. This response statistics also show that many people think that air pollution only exists in winter, and as soon as the smog is gone, the air quality is back to normal, which is not the case. This response also suggests the lack of information about air pollution among young people. Our result also shows that news, mobile applications, and social circles are dominant ways to get air quality-related information. Nearly 15% of people responded that they do not take any precautions to deal with air pollution. 31% of the total responses suggested that they have a respiratory condition, and out of those 31% people, 40% said that their condition aggravated due to poor air quality in Lahore. Lastly, 38% of people suggested that transport is the major contributor to poor air quality in Lahore. The rest of the people responded in favor of industries, agriculture, etc. This survey suggests the need to raise public awareness about the dangers of air pollution, and we suggest that including components on air pollution, its causes, and ways to deal with it must be included in the school, college, and university curriculums. We also recommend public meetings, town halls, and seminars to increase awareness among people.
Our investigation suggests that Lahore requires a massive improvement in its air pollution measurement capacity, the available air quality data from EPD is not reliable and requires immediate attention, and public awareness is something that we need to work on as soon as possible. EPD Punjab has developed an ambient air quality scale, and all values reported by EPD Punjab are based on that scale. EPD AQI scale is different from the US environmental protection agency (EPA) scale, which is normal, as many countries have their air quality measurement and reporting scales. These scales are decided based on the best practices in the surrounding countries, individual tolerance levels, etc. In our analysis, we compared Lahore’s air quality statistics to those from the EPD Punjab and the US EPA. Both scales are depicted in the following figure:
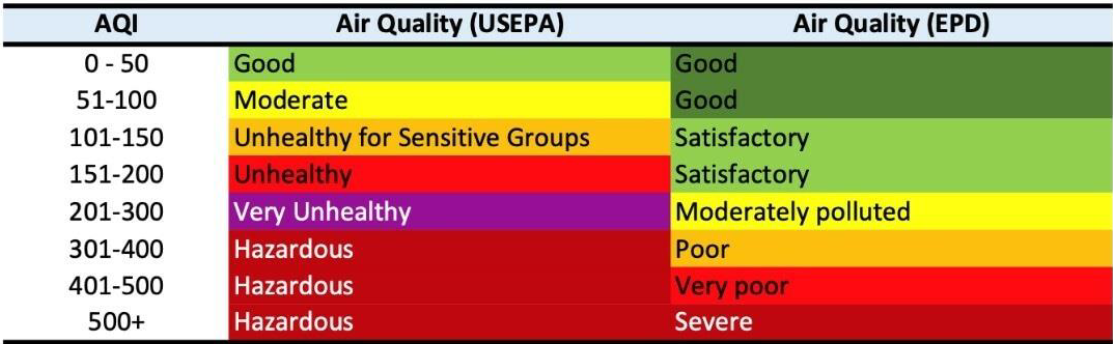
We have evaluated the available data for the last three years on both scales. When the data for Lahore Air quality is analyze d using the US EPA scale, Lahore had just one day of good air quality, 482 days of poor air quality, and 161 days of hazardous air quality, Whereas on the EPD Punjab scale, Lahore has 89 days of good air quality, 653 days of satisfactory air quality, and just six days of severe air pollution. Here, we are not arguing that EPD Punjab should not have developed its AQI scale; rather, we are arguing that the scale should represent the reality of Lahore’s air quality.
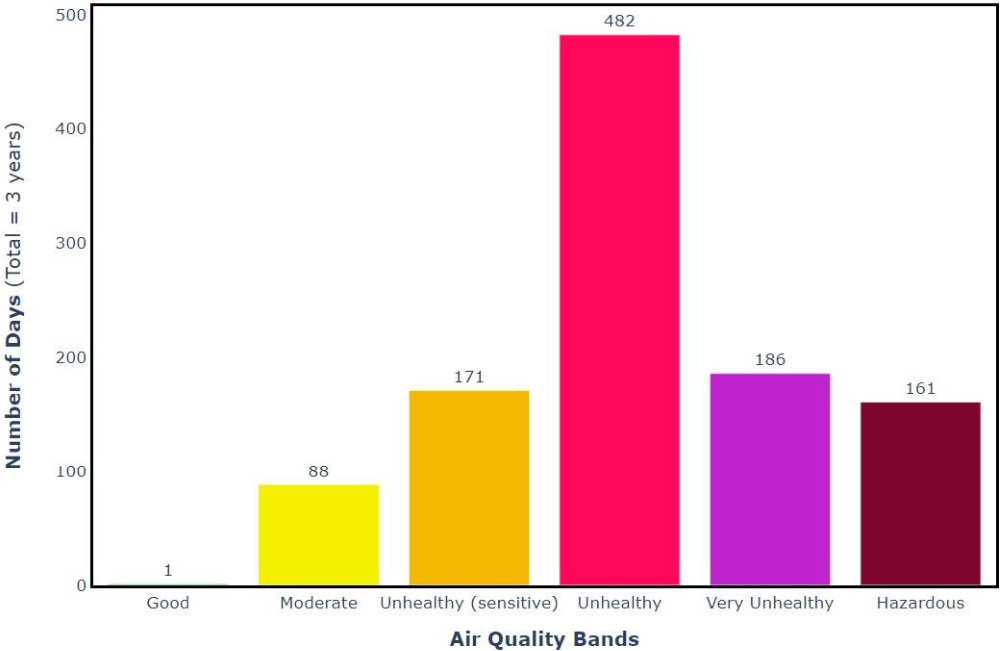
The number of days in the last three years is divided based on the AQI bands if the US EPA standards are followed.
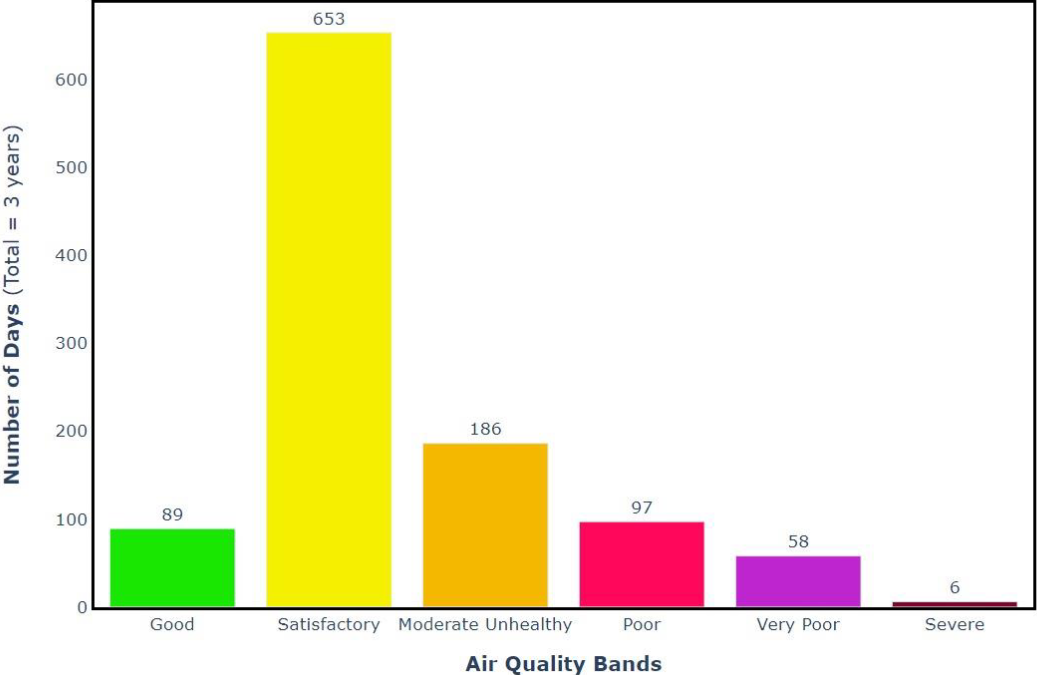
The number of days in the last three years is divided based on the AQI bands if the EPD Punjab standards are followed.
Now let us talk about the solution to this apocalyptic situation. There is no short-term solution to fix the air quality. The government should establish as many air quality monitoring stations as possible and make the data available to the public. The recommendations made in the Lahore smog commission findings are pertinent and must be adopted immediately. The enforcement of environmental protection law needs massive improvement. Only government can resolve this problem; the people must also support pro-air quality initiatives and participate in data collection. There are few success stories in Pakistan where concerned citizens are making a difference by deploying low-cost sensors and making their data publicly accessible. The government also needs to make data-driven policies to deal with the air-quality issues, and it can take the motivation and insights from China’s success story or even their own Lahore smog commission report.
In this study, we have investigated the ability of Lahore city to deal with the challenge of air pollution. We evaluated Lahore’s ability to deal with the air quality calamity in three fundamental areas capacity to measure, availability and reliability of the air quality data, and public awareness. We understand and acknowledge the efforts of EPD Punjab in dealing with the challenges involved in improving the air quality. Here are a few policy-level recommendations, in addition to the many others made in the Lahore smog commission report and the extensive literature on methods to improve air quality.
- Suggestions for improving the capacity of measurement:
- All government and private housing societies must install a reference-grade air quality monitoring station and make data available to its residents and the general public.
- All government and private educational institutes (schools, colleges, and universities) must install near reference or low-cost air quality monitoring systems, and all data must be made public.
- Every residential/office building should have a low-cost air quality monitoring station, and data must be made public.
- Government must ensure the subsidy on air quality monitoring stations and air purifiers.
- All known sources must be monitored and controlled by a single government/contracted entity.
Suggestions for improving the data reliability:
- Make an AQI scale that depicts the reality of the situation rather than some adjusted scale.
- Increase the number of air quality sensor calibration facilities in Punjab.
- One public dashboard should be developed for data coming from all public and private air quality sensing systems.
- Instead of outright rejections of the values and analysis of the academic community, EPD must encourage the academic community in doing air quality research and putting it out on social media platforms.
Suggestions for improving public awareness:
- Make air quality and its related content a part of the school, college, and university curriculum.
- Work with religious scholars and get the importance of the air quality in Jumma sermons and other religious events.
- Support seminars, town halls, etc. to raise public awareness.
- Give incentives to the residential and commercial areas where the air quality improves.
Lahore’s beautiful blue skies have been gone; let us work together to restore them by improving air quality and assisting the EPD and other relevant authorities. Data-driven policies are the way ahead, and this analysis should aid in that endeavor. Finally, we would like to emphasize that the data utilized in this study is publicly available, which means that anybody can examine it and draw conclusions. We have made every effort to provide what data indicates while avoiding bias against any public or private organization.