
Finding the blue skies: Lahore’s Air Apocalypse
March 4, 2024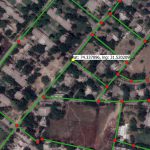
Extracting Road Network of Lahore from Open-Source Imagery
March 4, 2024Finding the blue skies: Lahore’s Air Apocalypse
March 4, 2024Extracting Road Network of Lahore from Open-Source Imagery
March 4, 2024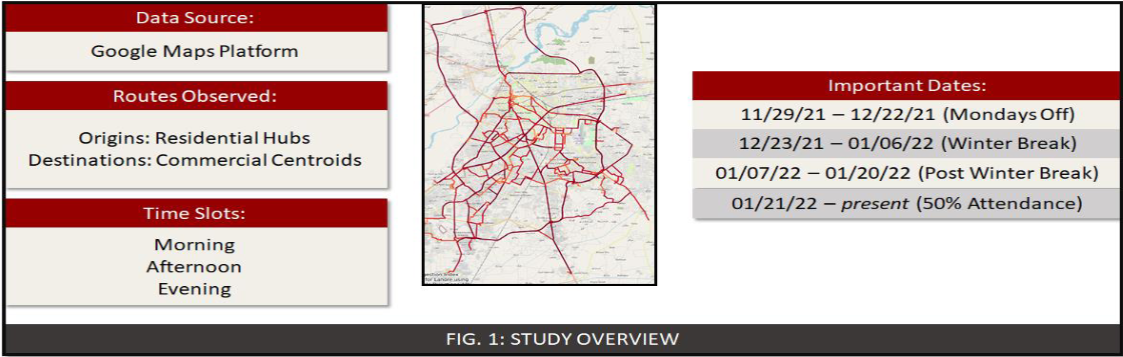
Exploring the bittersweet relationship of schools’ closure and smog
Executive Summary
While the onset of the fall season liberates the Lahoris from the scorching temperatures of summers, it paves the way for a far more severe threat: smog. This season, as the looming threat of smog-2021 shrouded the city of Lahore, the urban mobility experts within grand challenge fund (GCF) team at the Smart Data Systems and Applications (SDSA) cohort at Lahore University of Management Sciences (LUMS) donned their socially conscientious hats. Leveraging technology and data-centric expertise, our team is focused on pioneering data-driven analysis of policy decisions for the city of Lahore.
Tune in to find out more regarding our team’s effort in identifying the impact of schools’ closure policy on Mondays.
Executive Summary
This fall, as Lahore braced itself for yet another suffocating season of haze, smoke and fumes, the average Lahori was faced with a new dilemma. With the onset of the arcane new omicron variant, individuals were wondering whether their seatmates had the ‘seasonal cough’ or whether omicron had indeed penetrated Pakistan’s healthcare system.
As social media upped the ante on the pernicious effects of breathing an air that had a palpable taste of smoke, the provinci al government ordered the closure of schools on Mondays. This policy was put in place to alleviate the air quality with the introduction of a three-day weekend.
While the direct impact of this policy on air quality is not so easy to calculate due to factors other than urban traffic, the SDSA group of LUMS undertook a study to measure the impact of this policy on urban congestion. This policy, implemented on the 25th of November 2021, posits the significant contributions of urban traffic on smog levels.
With the ambition of analyzing urban mobility, our team has worked diligently to examine and inspect the variations in traffic congestions due to school closures on Mondays. The following write-up aims to navigate the reader through the steps taken to pursue this analysis followed by our findings. While we have presented a few recommendations based on the insights drawn from our data, the primary purpose of this study is to let the facts speak for themselves.
Moreover, due to the diverse reader base of this article, our goal is to incorporate brevity while steering away from technic al jargon. Should any statement prompt further explanation, the reader is welcome to approach our team through the below mentioned contact addresses. After all, instilling public awareness and extending approachable avenues for these discussions is what the SDSA g roup aims to offer.
Data Extraction
Similar to any data-driven analysis, the first step was to identify potential sources of data that may be used for this study. While our cohort has been constantly reaching out to, and collaborating with multiple public and private entities, we wanted to spearhead a study that may be inspired by any potential stakeholder in the future. Therefore, we confined our scope to the Google Maps Platform, an
Data Preprocessing
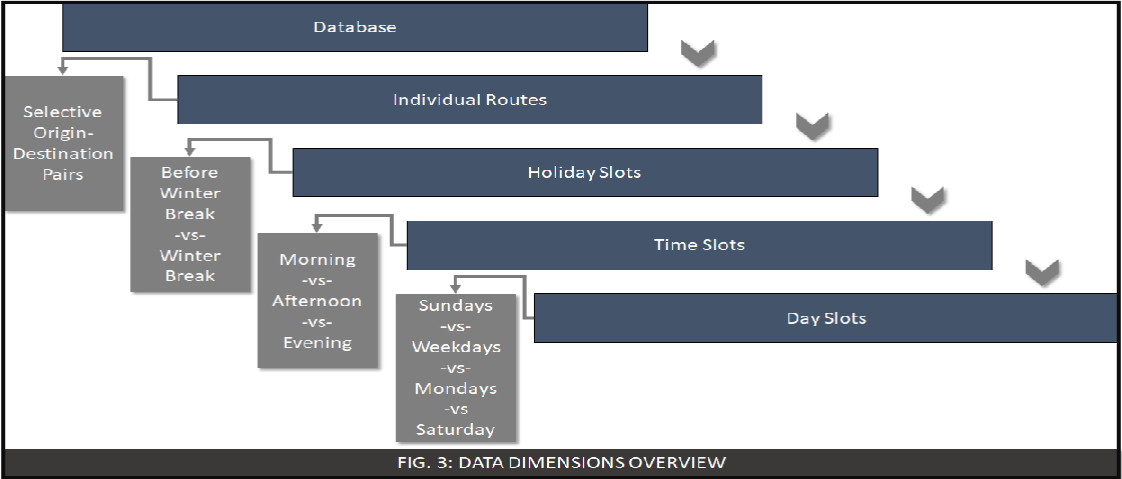
Following the extraction of our spatio-temporal database, we shifted towards the next part of our analysis: data preprocessing. Fig. 3 below serves the purpose of apprising the reader regarding the multiple dimensions of our database. Understanding the complex nature of this data will assist the reader in understanding our analysis along with our baseline assumptions.
Traffic Congestions Inference
Due to the multifaceted dimensions of our data, we needed a base variable that would act as a source of reference for comparison. Since we wanted to compare travel time variations, we first normalized these travel times by converting them to respective velocities (route distance divided by travel time) for each data row. This step enabled us to visualize variations in velocities.
Next, we decided to use Sunday’s velocities as the base values. As a result, we were able to compare the velocities for Mondays and Weekdays with respect to Sundays (common denominator) in the form of a percentage difference.
This percentage difference in velocities, for the purpose of this write-up, is being represented in the form of traffic congestions i.e., the greater the percentage difference in velocities from Sundays, the greater the increase in traffic congestions. Going forward, our team will be incorporating additional dimensions to this dataset with the ambition of analyzing the complexities involved in traffic mobility on a city level.
From this point onwards, our analysis will be based on traffic congestions for each route. After some data preprocessing steps, we directed our attention towards the insights that may be drawn from our database.
Data Insights
As the focal point of our study was centered around a data-driven analysis regarding the closing of schools on Mondays, we have first presented our results on a city level. Next, we decided to delve deeper into this problem by identifying the most congested routes. These routes were then mapped onto a schools heatmap to determine any causality between the proximity of a route with nearby schools.
City-wide Analysis
As a starting point, we have displayed a comparison of traffic congestions between Mondays, Weekdays and Saturdays through Figure 7. The graph below incorporates a side-by-side comparison between congestions before the winter break (Mondays off) and during the winter break.
While we encourage the readers to delve deeper into our analysis provided below, our aspirations lie in enabling our audience to draw additional insights based on their unique applications and expertise.
Before we begin, we would request the reader to recall the role of Sunday velocities that act as a base value through which traffic congestions were calculated. An immediate observation drawn from our database was that Sunday base velocities were lower during the winter break. This may be attributed towards an increase in city activity on Sundays during the holiday season.
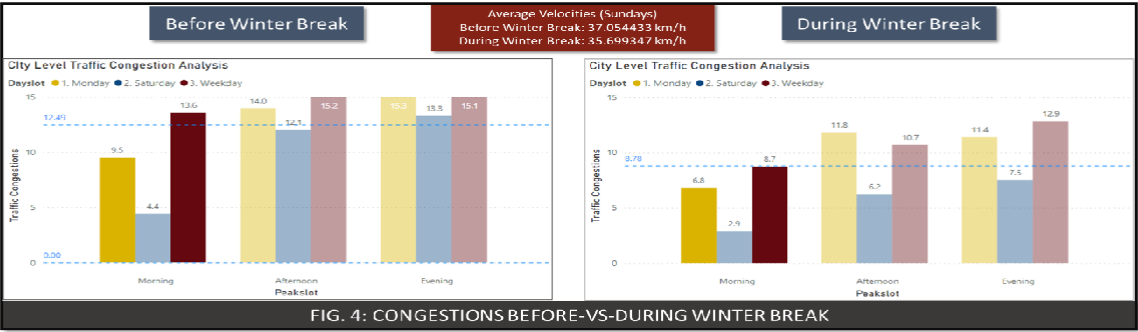
Next, we decided to observe the average congestions before versus during the winter break.
This average, computed separately for the two holiday slots, over all days and time slots would be indicative of how the city behaves on average with respect to Sundays. As evident from Fig. 6, we observe that average congestions before the winter break were higher. This clearly reflects the decreased city activity during the winter break on weekdays.
However, to determine the causality of schools, if any, we probed this problem with respect to times and days of the weeks.
Starting with Monday mornings, we record a decrease in congestions during the winter break which clearly follows the general trend. However, while the difference in congestions between Mondays and Weekdays before the winter break were 4.1 percentage points, this difference during the winter break decreased to 1.9 percentage points. This trend indicates that while congestions decreased for all days during the winter break mornings, the decrease for weekdays was much more thereby indicating that school closure policy did result in decreased traffic congestions citywide.
Moreover, if one was to compare the congestion values before versus during the winter break, Monday values decrease by 2.7 percentage points whereas, for Weekdays, this decrease is 4.9 percentage points, an observation that may be interpreted as a result of decreased weekday activity during the winter break.
Next, we decided to perform the same analysis while comparing weekdays with any other day besides Mondays. Since the probability of choosing any other day was fair, we decided to go with Thursdays since all we wanted was perform the same analysis that we carried out for Mondays versus weekdays. This time, we incorporated the Monday values in the weekdays slot.
A closer look at Lahore, one of the most populated cities of Pakistan, reveals further insights in population growth due to growing urbanization. While the majority of the population remains concentrated in northwestern and central Lahore, it has significantly spread out over the past two decades, perhaps owing to the development of new and modern settlements in the East and South, such as the Defence Housing Authority (DHA) and Bahria Town. Further inspection shows that not all areas experience a constant increase in density, with several regions having varying population densities across the 20 years. This might be indicative of population migration patterns at an intra-city level, or might simply be attributed to the margin of error in Worldpop’s population prediction model. Another interesting thing to note is the missing data in Central Lahore between 2000 and 2006, suggesting that certain attributes of these areas might be missing that WorldPop uses as input for its model.
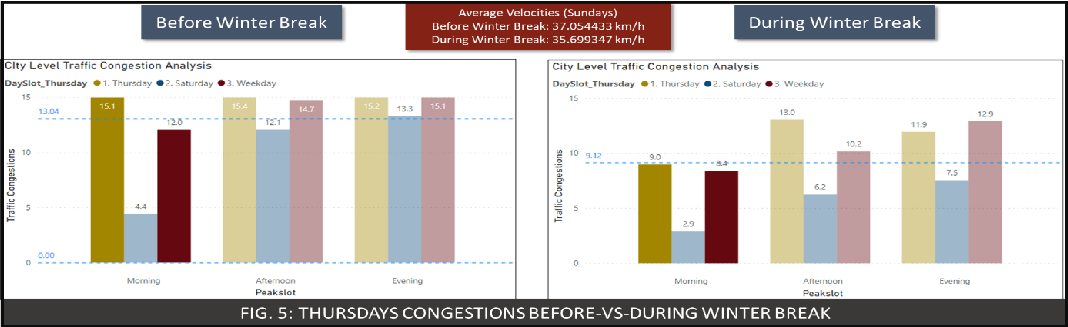
Firstly, it should be observed that Thursday congestions are beyond the mean congestions value before the winter break.
As well, we clearly see the impact of Monday congestions in the form of decreased weekday congestions before the winter break since Mondays were now included in the weekday slot. While the difference between Thursdays and Weekdays was 3.1 percentage points before the winter break, this difference shrinks to 0.6 percentage points during the winter break.
Moreover, comparing the two Thursdays together, we see a percentage decrease of 6.1 percentage points. For weekdays, this difference shrinks to 3.6 percentage points. Comparing this with the Monday values, we observe that the difference between Thursdays is greater as opposed to Mondays which points to a greater decrease in activity on Thursday mornings as opposed to Monday before and during the winter break.
Next, we decided to observe these changes on a daily level. The below figure corresponds to the congestion behavior of the city for each weekday.
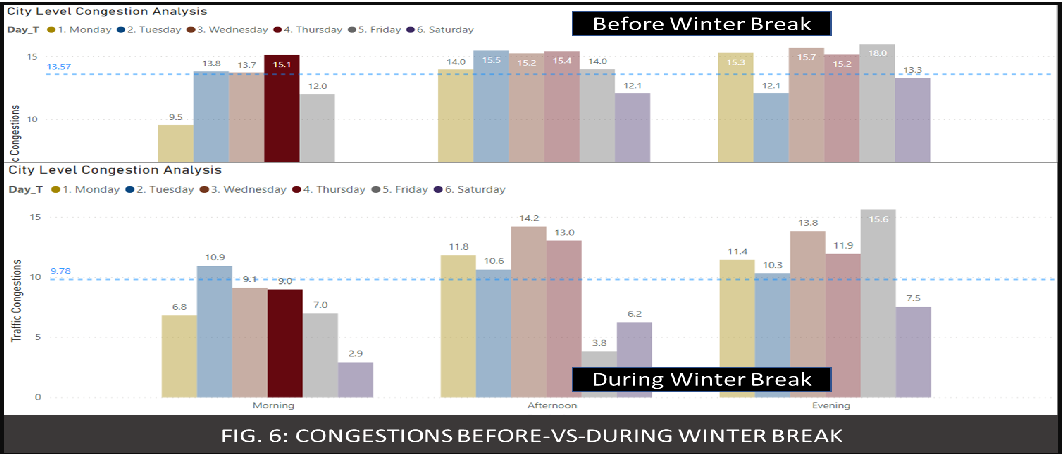
While the city-wide behavior of traffic congestions depends on a multitude of factors, one of them being schools, our data shows that the greatest percentage decrease in congestions was observed on Thursdays (6.1 percentage points).
For Mondays, we observe that congestions are generally low irrespective of any school activity. This observation may assist t he reader in reaching the conclusion that, if all factors pertaining to our data extraction timeline are kept constant, closing schools on Thursdays would have the greatest impact in terms of reducing traffic congestions that may translate into an alleviated air quality index.
While our results are primarily related towards observing morning trends, we leave it up to our readers to dissect and analyze congestion trends for afternoons and evenings.
Journey Level Analysis
Then, we gravitated towards observing individual routes. For the purpose of this write-up, we shortlisted the top routes that had the greatest difference in congestions on weekday mornings only (Mondays not included)
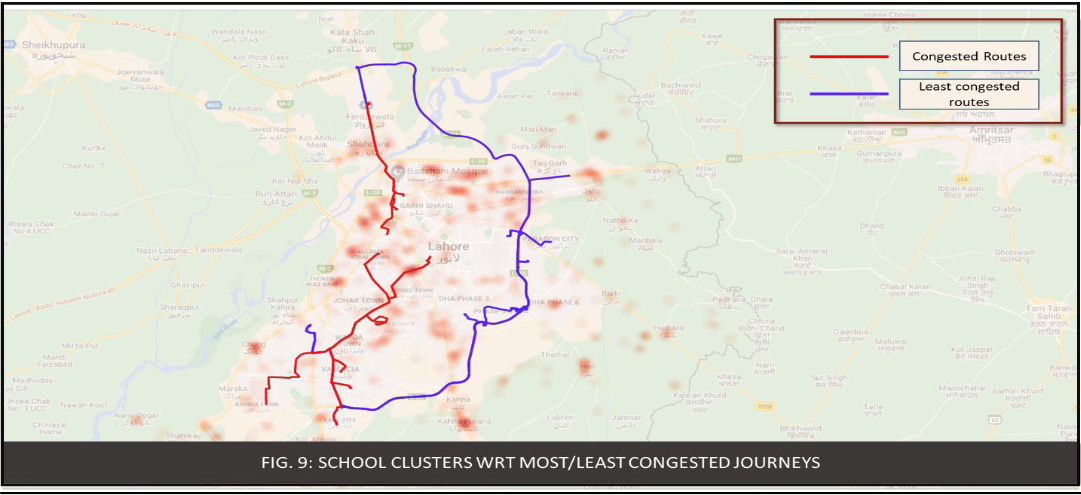
As an example, the most congested route observed was from Valencia Town to Hali Road. The below figure represents the congestion analysis for this journey.
While we leave it to the reader to analyze the trends for this journey, we decided to plot this route in a geospatial map and try to observe it with respect to a schools heatmap. For the purpose of this write-up, we used the Google Maps Platform to extract schools’ data points for Lahore. Moreover, we also identified the least congested routes that, without any surprise, turned out to be the routes that involved the Lahore Ring Road.
Conclusion:
As rising temperatures hail the onset of the spring season, Lahoris have presumed that smog has crawled back into hibernation. While we are well aware that this uninvited guest will knock at Lahore’s doors again, our resolve to defer recurring threats for the present moment is stronger.
Our team, however, is adamant that this is the time to act. We must plan ahead to minimize the repercussions of the smog season next fall by identifying and analyzing the efficacy of the reactive steps that each of us took during this season. Bearing this objective in mind, SDSA will be releasing its findings and studies that were undertaken during this season.
Smog-2021 has conveniently settled as an inconvenience of the past but, smog-2022 should not be ignored!
1. As our analysis draws on variations in velocities with respect to Sundays (traffic congestions), the first insight indicates that average velocities were lower during the Sundays of winter break.
2. This increase in Sunday congestions during the winter break indicates, intuitively, the increased citizen activity during the holiday season.
3. Average congestions during the winter break are lower therefore, the spread in velocities with respect to Sundays are lower during the winter break. 4. This indicates that the city draws closer towards uniformity in terms of velocities on weekends versus weekdays during the winter break.
5. Monday congestions on average are lower as compared to the weekday counterparts however, the difference between them for the two holiday slots varies.
6. Before the winter break, congestion difference between Mondays and Weekdays is higher indicating a decrease in traffic movement on Mondays; an indicator of the impact of school closure.
7. During the winter break, while the difference between Mondays and Weekdays dials down, it is clear that Monday in general has decreased traffic congestions.
8. Lastly, a comparison for all weekdays indicates the greatest decrease in congestions for Thursdays. While we are aware that these results may include a myriad number of other factors, our data suggests that days beyond Mondays should be considered for reaping the highest reward in terms of alleviating traffic congestions.