

Population in Pakistan and Data: An Overview
March 5, 2024
Speed Management Policy
March 5, 2024Population in Pakistan and Data: An Overview
March 5, 2024Speed Management Policy
March 5, 2024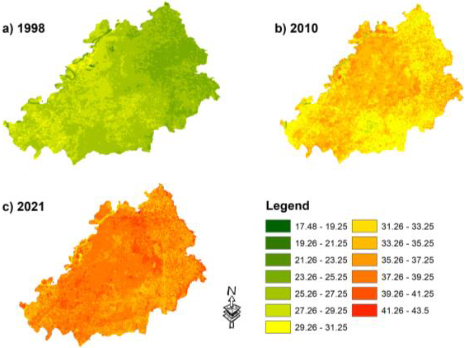
Urbanization and its Impact on Land Surface Temperature
Urbanization is a global phenomenon, it has intensified and grown more dynamically in developing countries, particularly in South Asia. Pakistan have also been escalating rapidly with an annual rate of 3 percent. In Pakistan, the urban population has grown from 32.5 percent in 1998 to 36.4 percent in 2017. It is expected that approximately 50 percent of the country’s population will be residing in urban areas by 2025 (UNDP, 2019). Cities in Pakistan are facing tremendous pressure due to rapid urbanization. They are being extended haphazardly, putting strain on already depleting natural recourses by replacing agricultural and vegetation lands. While these land use/land cover (LULC) transformations have a positive impact on the urban economy, they harm the urban environment significantly (McCarthy, Best, & Betts, 2010). The most immediate implications of urban land conversion are the transition of Land surface temperature (LST) and the formation of an Urban Heat Island (UHI). LST is a major climatic variable that varies based on the various uses of the land surface (Mundia & James, 2014; Xian & Crane, 2005). It primarily occurs as a result of the transformation of green areas (natural surfaces) into buildings (artificial surfaces).
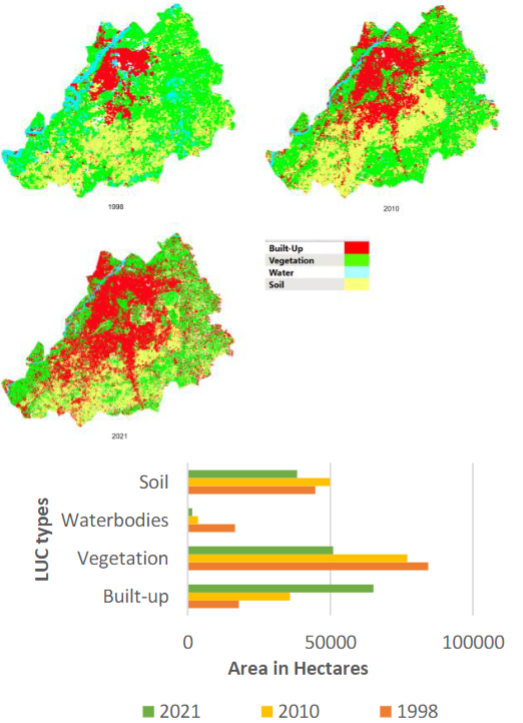
Lahore being the second-largest city in Pakistan and home to approximately 11 million people encounters the severe problem of air pollution due to accelerated urbanization, rapid economic growth, and a high level of migration. In November 2021, the city was ranked as the most polluted city worldwide for the consecutive second year. Moreover, heatwave has now become a frequent phenomenon in the major cities of Pakistan. We have used spatial analysis and remote sensing techniques in geographic information systems (GIS) to estimate LST and LULC in Lahore. The spatial distribution of LST and its association with LULC are investigated using satellite images from Landsat 5 (TM) and 8 (OLI/TRS) for the years 1998, 2010, and 2021. The Landsat imagery is classified into four LULC categories including built-up areas, soil, water bodies and vegetation. Land use/land cover classification for 1998, 2010, and 2021 for the ROI are shown. Overall, there has been a transformation in all the land use types, where vegetation and water bodies were found to be on the decline, while built-up use grew significantly. The LULC classification indicated that between 1998-2010, an area of 7,300 hectares of vegetation was transformed to other land uses (84,290-76,990). The vegetation area further declined to 51,030 hectares in 2021. In Lahore, the built-up area has increased from 17,930 hectares (10%) to 35,900 hectares (21%) between 1998 and 2010, while it has surged from 35,900 hectares (21%) to 65,180 hectares (39%) from 2010 to 2021. Each year 1.26% of the land is being transformed into built-up area.
Consequently, with an increase in built-up area, land surface temperature (LST) has also shown an increasing trend. The land surface temperature (LST) distribution in Lahore in 1998 varies from a minimum of 17.47oC to a maximum of 34.46oC. In 2010, LST has a minimum of 23.25oC to a maximum of 40.69oC. While in 2021, the LST values vary from a minimum of 26.32oC to a maximum of 43.52oC. In 1998, 2010, and 2021, the average LST was 26.52oC, 32.87oC and 37.40oC, respectively. Overall there is an average increase of 0.47oC per year between 1998 and 2021.
In contrast, the association between LULC and LST implies that built-up regions observed the highest increase in LST while areas under water and vegetation have the least variation in LST values. This shows that heatwaves and Urban Heat Island (UHI) are mostly caused by uncontrolled urban growth, a constant loss of vegetation owing to urbanization, and an increase in the area covered by impermeable surfaces.