
Extracting Road Network of Lahore from Open-Source Imagery
March 4, 2024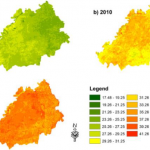
Urbanization and its Impact on Land Surface Temperature
March 5, 2024Extracting Road Network of Lahore from Open-Source Imagery
March 4, 2024Urbanization and its Impact on Land Surface Temperature
March 5, 2024
Population in Pakistan and Data: An Overview
"Architecture is an embodied and emotional experience with the ability to shift human behavior and elicit emotional responses such as awe."
2.1 Finding Shortest Path
The popularity of online shopping, ride-sharing, and online meal delivery applications has exploded in recent years. For services such as tracking and shortest path finding, all organizations in these domains rely substantially on third par- ties (such as Google). These services consume a significant percentage of their budget which can be avoided by using road network. Logistic companies such as TCS, M&P, Leopards Courier, DHL, and FedEx can use road network and reduce the cost spent for the services availed from third parties. Similarly, meal delivery companies like Foodpanda, Cheetay can use it for their benefit. Ambulance services rely heavily on their ability to respond quickly. They need to go to the accident site as quickly as possible, and there is sometimes a lag in response when using third-party services due to network issues. Therefore, ambulance services like Rescue 1122 and Edhi can incorporate road network to improve their services.
A Brief History
Efforts to collect population density data in Pakistan predate the inception of the country: according to the Pakistan Bureau of Statistics, the first regular population census in what is now Pakistan was conducted back in 1881. The first census after independence was conducted in 1951, and the most recent census was conducted in 2017, the sixth such undertaking by the Government of Pakistan. The first census was conducted by a census organization established in 1950 as part of the Ministry of Home Affairs, however after several institutional changes, it is now conducted by the aforementioned Bureau of Statistics.
Is Census the Only Way?
While census data presents itself as the effective “ground truth” that may be analyzed to study population growth and trends, its non- granular nature limits its versatility in data analytics. However, several institutions around the globe have launched projects that use the collected census data along with geographic data, remote sensing, and imagery analysis techniques to disaggregate census counts within an administrative boundary. These spatiotemporal counts enable data analysts to extract meaning from observable trends and forecast population growth and migration. Two such projects stand out because of their popularity, and are mentioned below:
- WorldPop: a project funded by the Bill & Melinda Gates Foundation, USAID, and several other organizations and research institutes.
- Landscan: a project of the Oak Ridge National Laboratory, a federally funded research and development center sponsored by the US Department of Energy.
The analyses conducted using these sources present several insights to the naked eye of a general reader, but one might question their reliability against the census data, i.e., our ground truth. Researchers have debated over the credibility of both projects, with one having an upper hand over the other in different regions of the world. However, in Pakistan’s context, we will be drawing comparisons between both projects and using the following performance metrics to gauge their reliability:
- Mean Absolute Error (MAE): 1 𝑁∑𝑁𝑖=1 |𝑓𝑖 −𝑟𝑖| (Delineating error within the dataset, lower is better)
- Root Mean Square Error (RMSE): √1 𝑁∑𝑁𝑖=1 (𝑓𝑖 −𝑟𝑖)2 (Outliers stand out, lower is better)
- Correlation Coefficient (CC): 𝑐𝑜𝑣(𝑓,𝑟) 𝑠𝑡𝑑(𝑓)∗𝑠𝑡𝑑(𝑟) (closeness to -1 or +1 indicates strong positive or negative relationship between actual and estimated parameter)
Here, f represents the predicted numbers, r corresponds to the ground truth numbers (i.e. the census data), and N is the total number of tehsils i in each city.
Worldpop gets some early points for its higher 100m resolution, compared to Landscan’s 1000m resolution. However, for this section, we will be using Worldpop’s 1000m resolution data for a fair comparison. The tables below summarizes the results for three of Pakistan’s major cities:
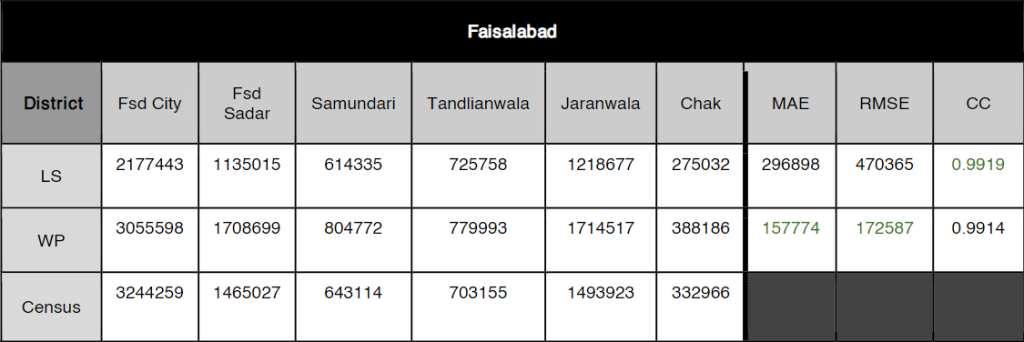
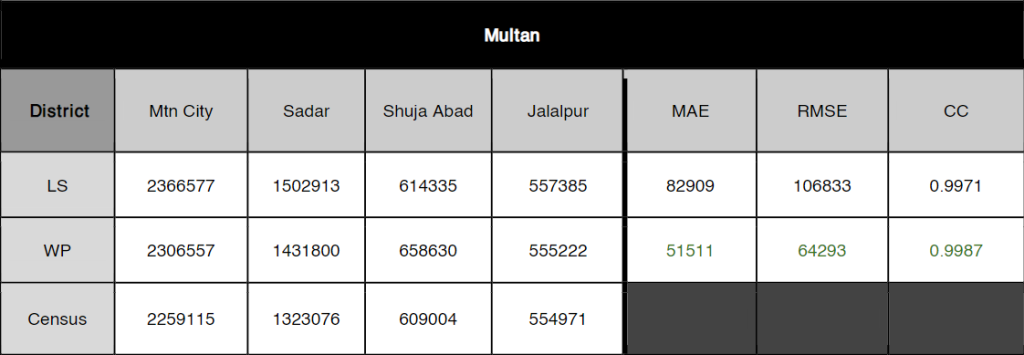
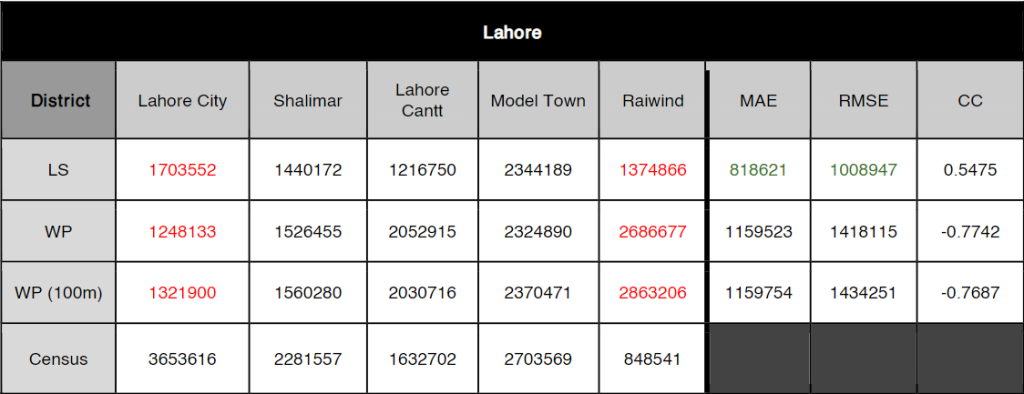
For Faisalabad and Multan, both Landscan and Worldpop’s predicted population data are strongly correlated with the census data, although the error figures are very significant. Again, this may highlight the inaccuracy of the prediction model, or perhaps question the reliability of the census ground truth (more on that later).
Lahore’s numbers, on the other hand, are quite striking as they are significantly different when compared to the other two cities. Worldpop’s model performs relatively worse compared to Landscan, showing a negative correlation and in significant contrast to its performance for Multan and Faisalabad. More astonishing, however, is the difference between the census count and the model
predictions for certain tehsils of Lahore: both Landscan and Worldpop’s models underestimate the population in Lahore City, Lahore’s most populated tehsil. Additionally, for Raiwind tehsil, both Landscan and Worldpop predict population numbers that are greater than the census count by approximately 1.5 times and 3 times respectively. Worldpop’s 100m spatial resolution model was then brought into the scene to calculate similar performance metrics for Lahore, but it presents a similar story to Worldpop’s 1km spatial resolution model. Questions raised over the ability of these population density models to perform well in densely packed regions with multi-story buildings (e.g. Lahore City tehsil) and larger industrial areas with a relatively sparse population (e.g. Raiwind tehsil) leave room to be verified and explored. An initial approach could be to conduct the same analysis in other regions of Pakistan with similar attributes, and modify these prediction models in ways that lead to better performance in Pakistan and similar regions across the globe.
Taking Census with a grain of salt
Population census data has been treated as the ultimate “ground truth” in our analysis. However, census data is also subject to certain errors in data collection and processing, as is the case with any data collected at any scale. Oftentimes errors arise due to inclusion of people in the enumeration who should not have been included (e.g. non-residents), or exclusion of people who should have been included (e.g. residents of missed addresses and housing units, and people with no residence). Similarly, geocoding errors (placing an address in the wrong census geographic location) and demographic errors (an individual’s demographic characteristics are incorrectly reported or assigned), among others, may also undermine the credibility of the data. So while we attribute any differences between the census data and the data of the aforementioned projects to the population prediction model used in these projects, the uncertainty revolving census data should not be ignored. Techniques and methods, however, do exist that can improve the quality of census data. The United States Census Bureau improves census data using randomized experiments, alternate sources of data collection, and carefully planned evaluations, among other techniques.
In the next part, we will be exploring how Pakistan’s population has grown over the last two decades, and why studying these trends is important for the present and future of the country.
Population in Pakistan and Data: An Overview Part 2
Author: Huzaifa Khan Suri

In part 1 of the blog, we discussed the origins of census data collection in Pakistan, and compared some projects that make use of census data and other covariate layers to map population density across the globe. It is now time to shift gears and turn our attention to population growth trends in Pakistan, and how studying population data could be immensely beneficial in Pakistan’s context.
Pakistan’s population continues to grow at an alarming rate: the 2017 census showed a shocking 57% growth in population numbers since the last time the census was conducted back in 1998, putting Pakistan right up there with countries such as China and t he United States. And while there has been a decline in birth rates since the turn of the new century, it still remains a point of concern as the country continues to struggle with an ever-increasing debt, coupled with shortages and mismanagement of resources; a steep growth in population would only exacerbate these issues.
The reasons for such unprecedented growth can be broadly categorized – according to most sources – into religious taboos, political timidity, and public ignorance. The concept of birth control and family planning is largely absent in the country, despite efforts to create social awareness by several institutions, as only a third of married Pakistan women use any form of birth control. These problems are more widespread in rural areas, which housed around 63% of Pakistan’s population in 2020 compared to 37% people in urban areas; the latter group is generally better educated and more aware of social issues because of a relatively better standard of living and greater exposure to advertisements and campaigns, while the majority of Pakistan’s population, belonging to the former group, is deprived of such exposure.
Population Growth Visualized
For our analysis on Pakistan’s population growth, we will be using data from Worldpop. As discussed in Part 1 of the blog, Worldpop’s datasets, most notably, have a spatial resolution of 100m; in contrast, census data is publicly available at the district or tehsil (an administrative subdivision of a district) level which usually span several kilometer squares in area, and consequently have a much lower resolution. Similarly, projects such as Landscan have a lower resolution too. Hence, Worldpop’s consistent performance and better resolution make it a good choice for our visual analysis.
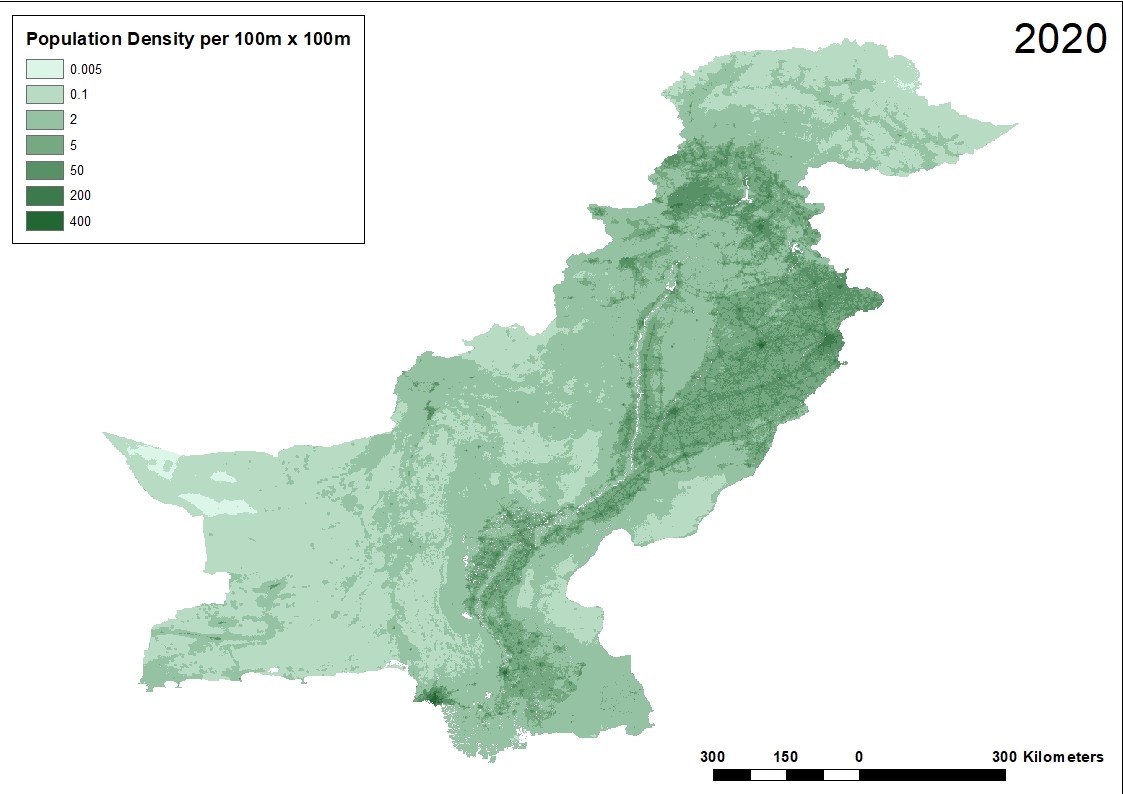
For our analysis on Pakistan’s population growth, we will be using data from Worldpop. As discussed in Part 1 of the blog, Worldpop’s datasets, most notably, have a spatial resolution of 100m; in contrast, census data is publicly available at the district or tehsil (an administrative subdivision of a district) level which usually span several kilometer squares in area, and consequently have a much lower resolution. Similarly, projects such as Landscan have a lower resolution too. Hence, Worldpop’s consistent performance and better resolution make it a good choice for our visual analysis.
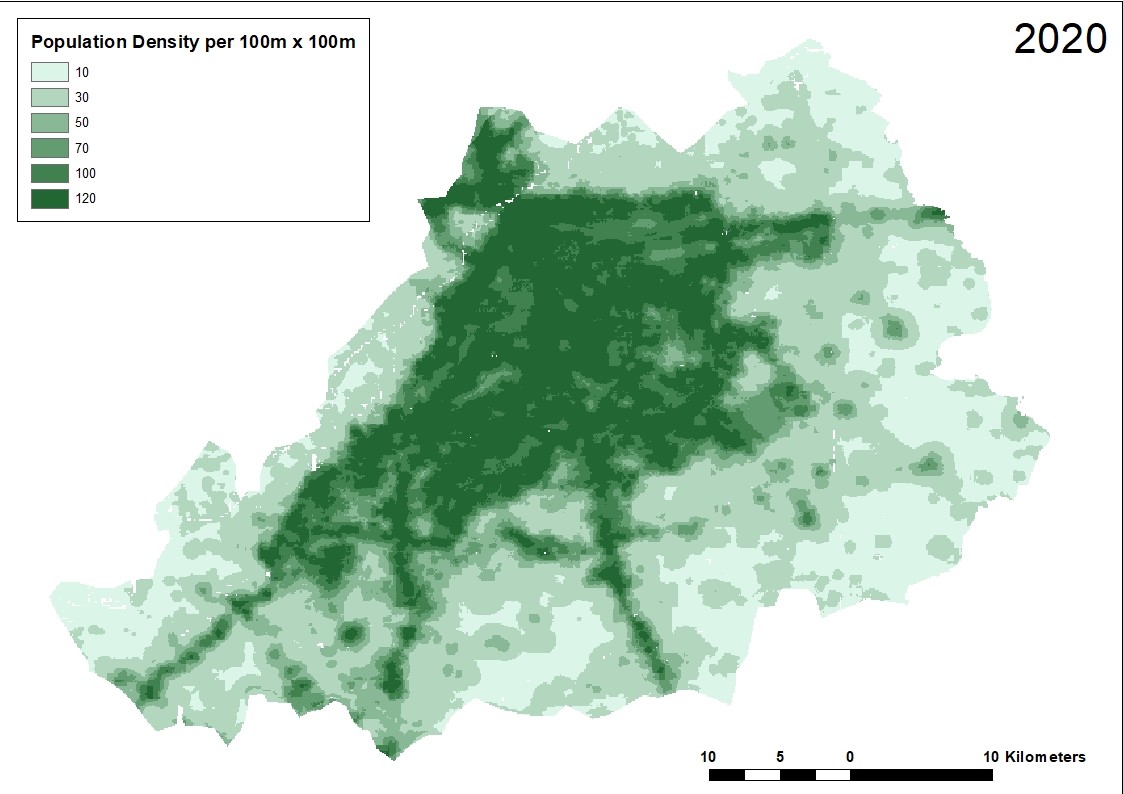
A closer look at Lahore, one of the most populated cities of Pakistan, reveals further insights in population growth due to growing urbanization. While the majority of the population remains concentrated in northwestern and central Lahore, it has significantly spread out over the past two decades, perhaps owing to the development of new and modern settlements in the East and South, such as the Defence Housing Authority (DHA) and Bahria Town. Further inspection shows that not all areas experience a constant increase in density, with several regions having varying population densities across the 20 years. This might be indicative of population migration patterns at an intra-city level, or might simply be attributed to the margin of error in Worldpop’s population prediction model. Another interesting thing to note is the missing data in Central Lahore between 2000 and 2006, suggesting that certain attributes of these areas might be missing that WorldPop uses as input for its model.
Can population data shape a better future?
Population density data holds immense potential that may add value to several research avenues in urban development, mobility, air quality, health, infrastructure, and much more. Countries pioneering in planned settlements and optimized resource allocation make extensive use of such data, and the advent of modern AI and machine learning tools have only increased the exciting possibilities that this field of study has to offer. Pakistan, in particular, can immensely benefit from high-quality, high-resolution population data. The country’s struggle to eradicate polio continues to this day, unfortunately, but high-resolution data on infant density can help authorities narrow down their efforts and use resources more efficiently. Other vaccination strategies can be planned in the same manner. Similarly, projects focused on women mobility and empowerment may be initiated in regions with a greater female to male ratio to maximize impact. Many such directions can be explored and worked upon to extract maximum benefit from an extensive population density map. We at the Smart Data Systems & Applications (SDSA) laboratory at LUMS are exploring these avenues, especially as part of the Grand Challenge Fund project, as we strive to suggest data-driven changes in policy and create mass-awareness among the local populace. Find out more about us, our work, and the Grand Challenge Fund project, on https://sdsa.lums.edu.pk/.